
|
Fig. 6
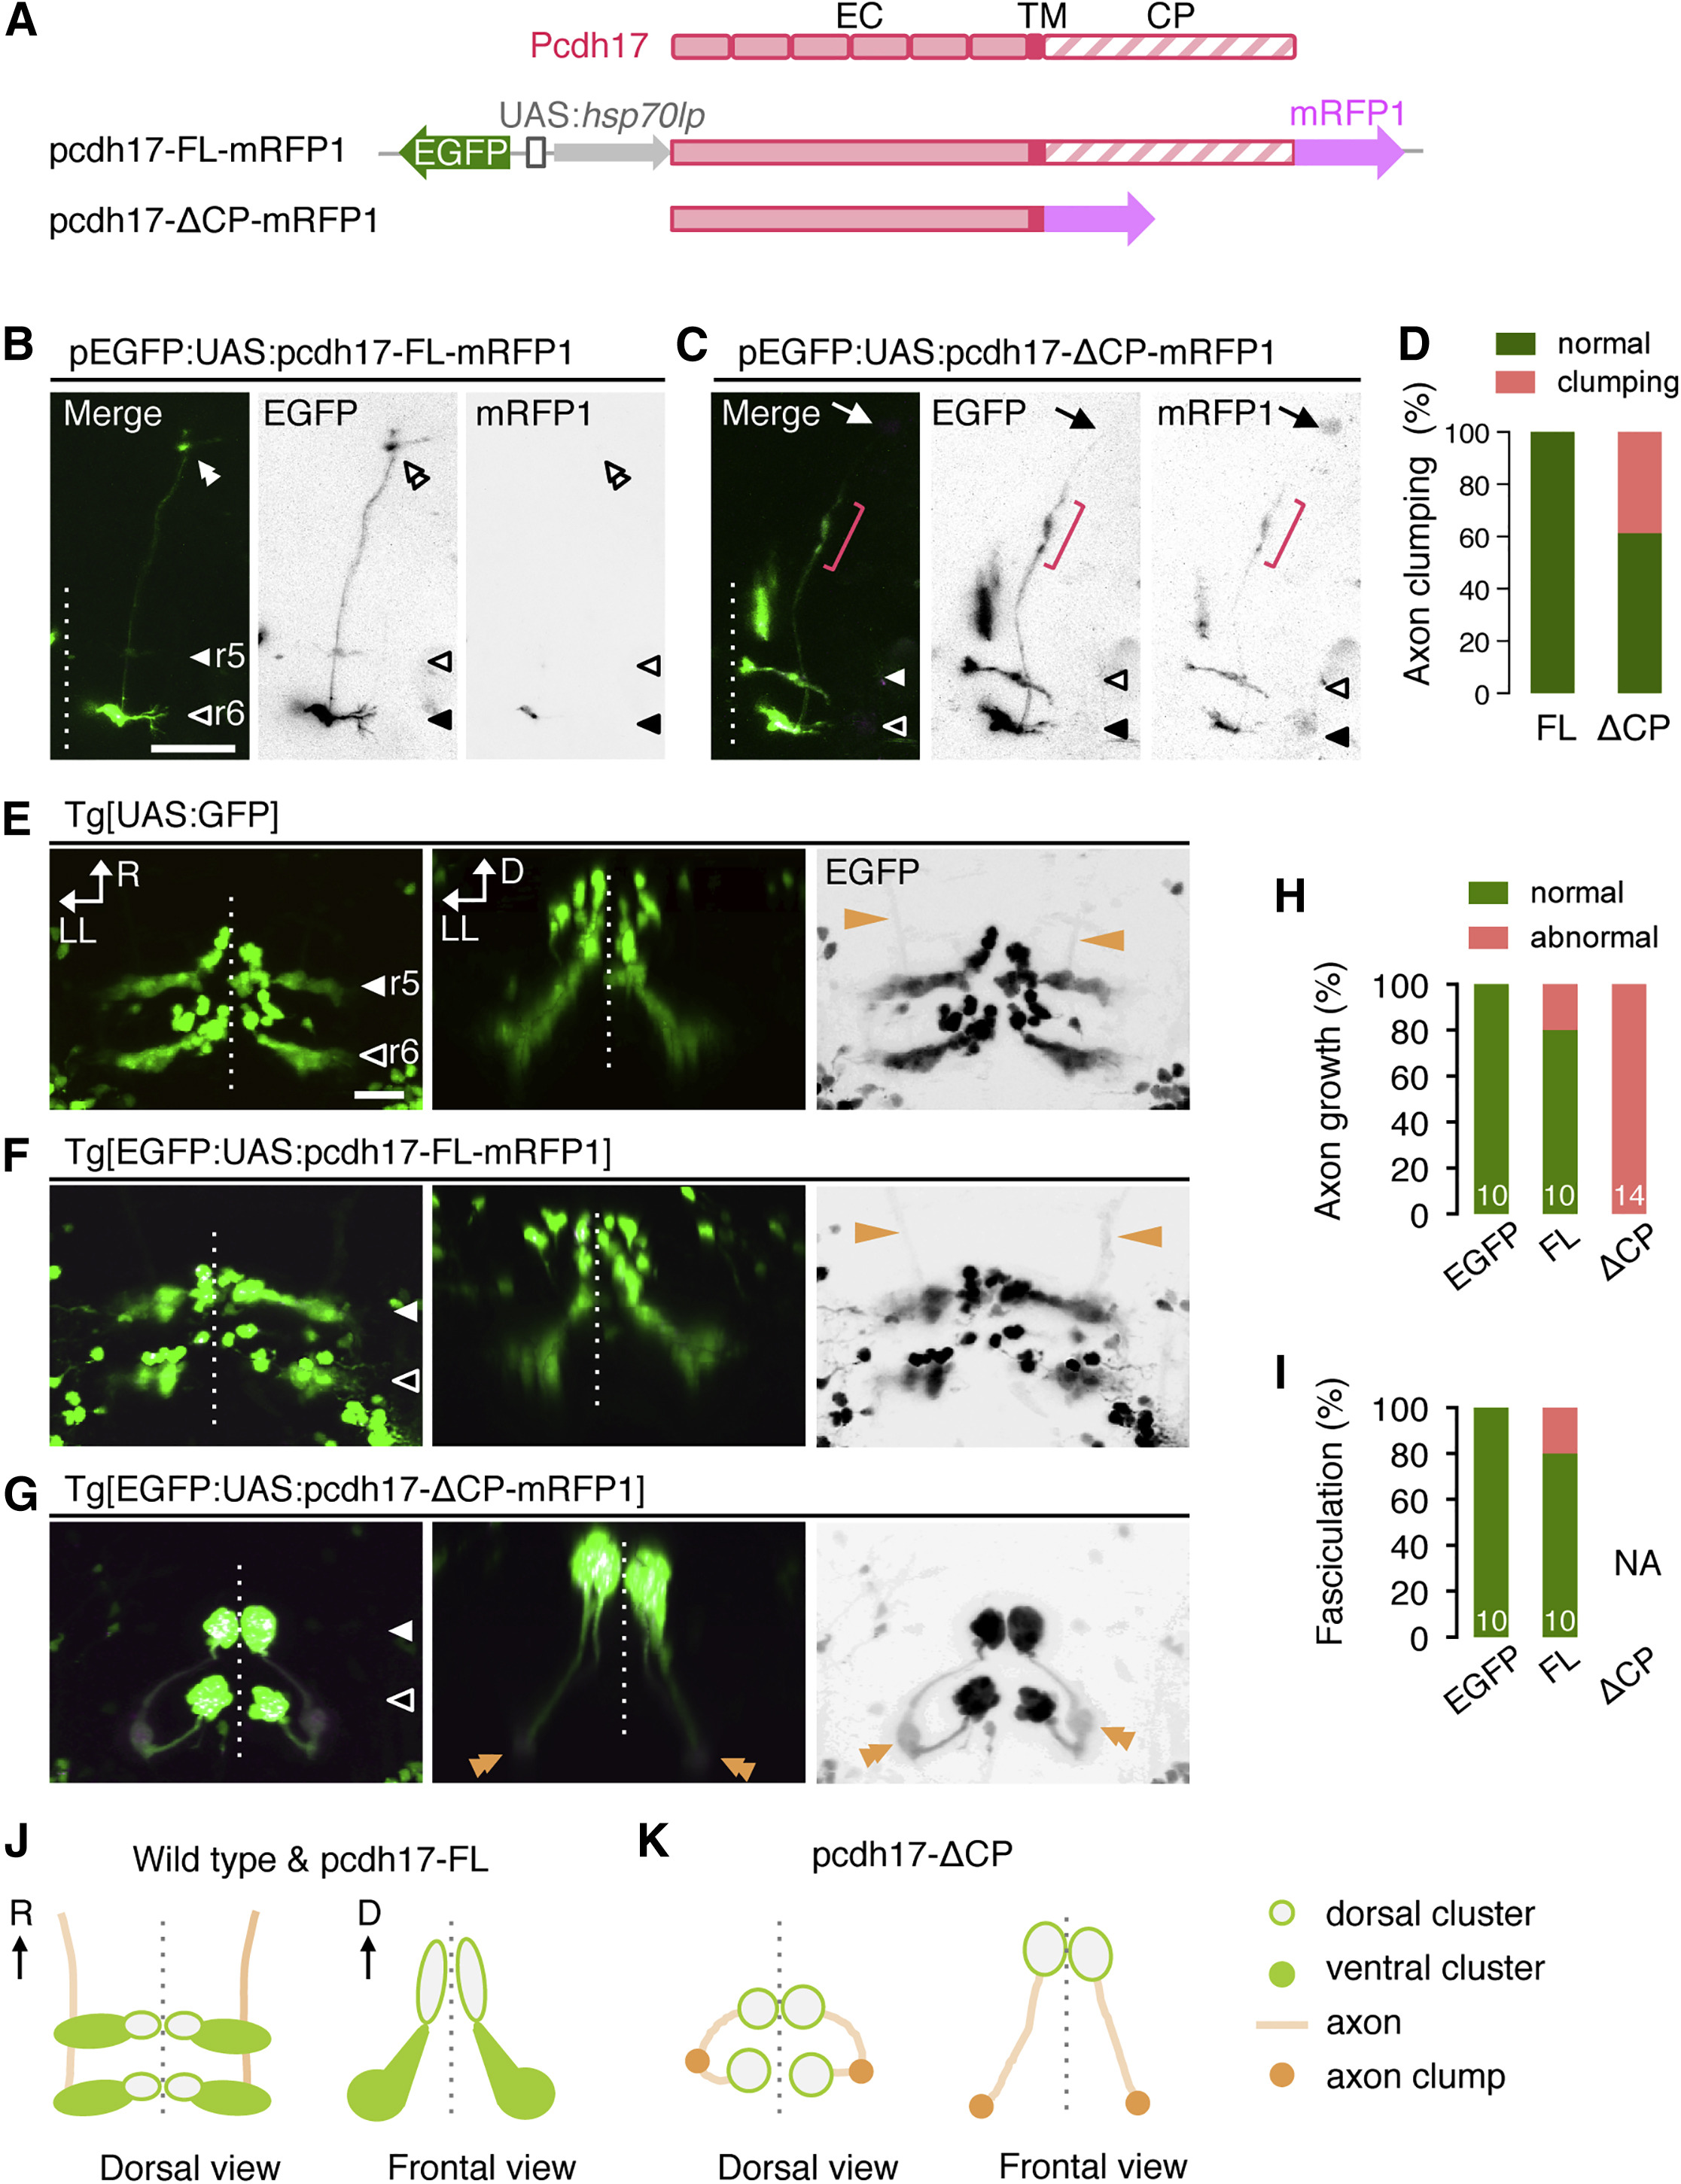
Dominant-Negative Pcdh17 Disrupts Nuclear Topography and Axon Growth of mnr2b-ABNs
(A) Bidirectional UAS constructs for expression of the mRFP1-tagged full length (pcdh17-FL-mRFP1) and dominant-negative Pcdh17 (pcdh17-ΔCP-mRFP1).
(B and C) Dorsal views of the right brain hemispheres of Tg[mnr2b-hs:Gal4] larvae injected with the UAS constructs for the full-length pcdh17 (B) or pcdh17-ΔCP (C). In (C), the nerve terminal and axon clump are indicated by an arrow and a red bracket, respectively.
(D) Frequency of the axon clumping. For pcdh17-FL and pcdh17-ΔCP, 9 nerves from 6 animals and 18 nerves from 11 animals were examined, respectively.
(E–G) Dorsal (left, right) and rear (middle) views of r5 and r6 at 3 dpf. The orange arrows and double arrowheads indicate the normal and clumped axons, respectively.
(H and I) Frequency of abnormal axon growth (H) and fasciculation (I). Numbers in the histograms indicate the numbers of nerves examined. NA, not applicable because of severe axon growth defect.
(J and K) Schematic illustrations of normal (wild-type and pcdh17-FL) (J) and abnormal (pcdh17-ΔCP) (K) nuclear formation and axon growth of mnr2b-ABNs.
Scale bars indicate 50 μm in (B) and (C) and 20 μm in (E)–(G).