
|
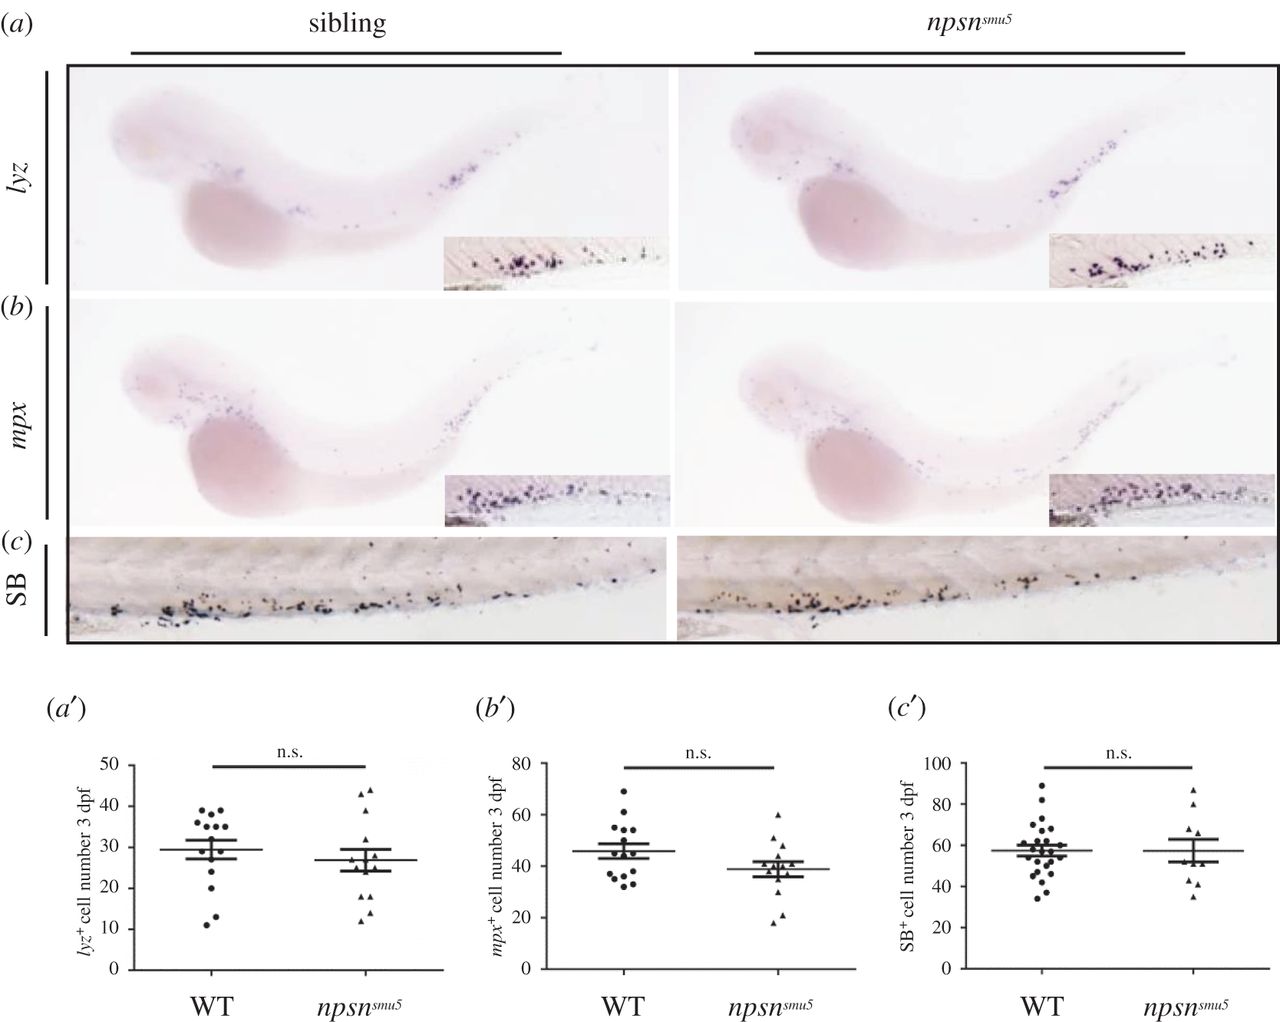
Fig. 3
npsn deficiency does not affect neutrophil number in zebrafish. (a and a′) WISH analysis of lyz expression and quantification of lyz+ cells in the PBI at 3 dpf (29.5 ± 2.3 versus 26.9 ± 2.7) in WT sibling and npsnsmu5 mutant groups. (Mean ± s.e.m., n = 15 in each group, triplicated). Boxes in the lower right corner outline the magnified PBI regions. (b and b′) WISH analysis of mpx expression and quantification of mpx+ cells in the PBI at 3 dpf (45.9 ± 2.9 versus 38.9 ± 2.9) in WT sibling and npsnsmu5 mutant groups. (Mean ± s.e.m., n = 15 in each group, triplicated). Boxes in the lower right corner outline the magnified PBI regions. (c and c′) Sudan Black staining (SB) and quantification of SB+ cells in the PBI at 3 dpf (57.5 ± 2.7 versus 57.4 ± 5.4) in WT sibling and npsnsmu5 mutant groups). (Mean ± s.e.m., n ≥ 10 in each group, triplicated). Statistical significance was determined by unpaired t-test. n.s., not significant.