
|
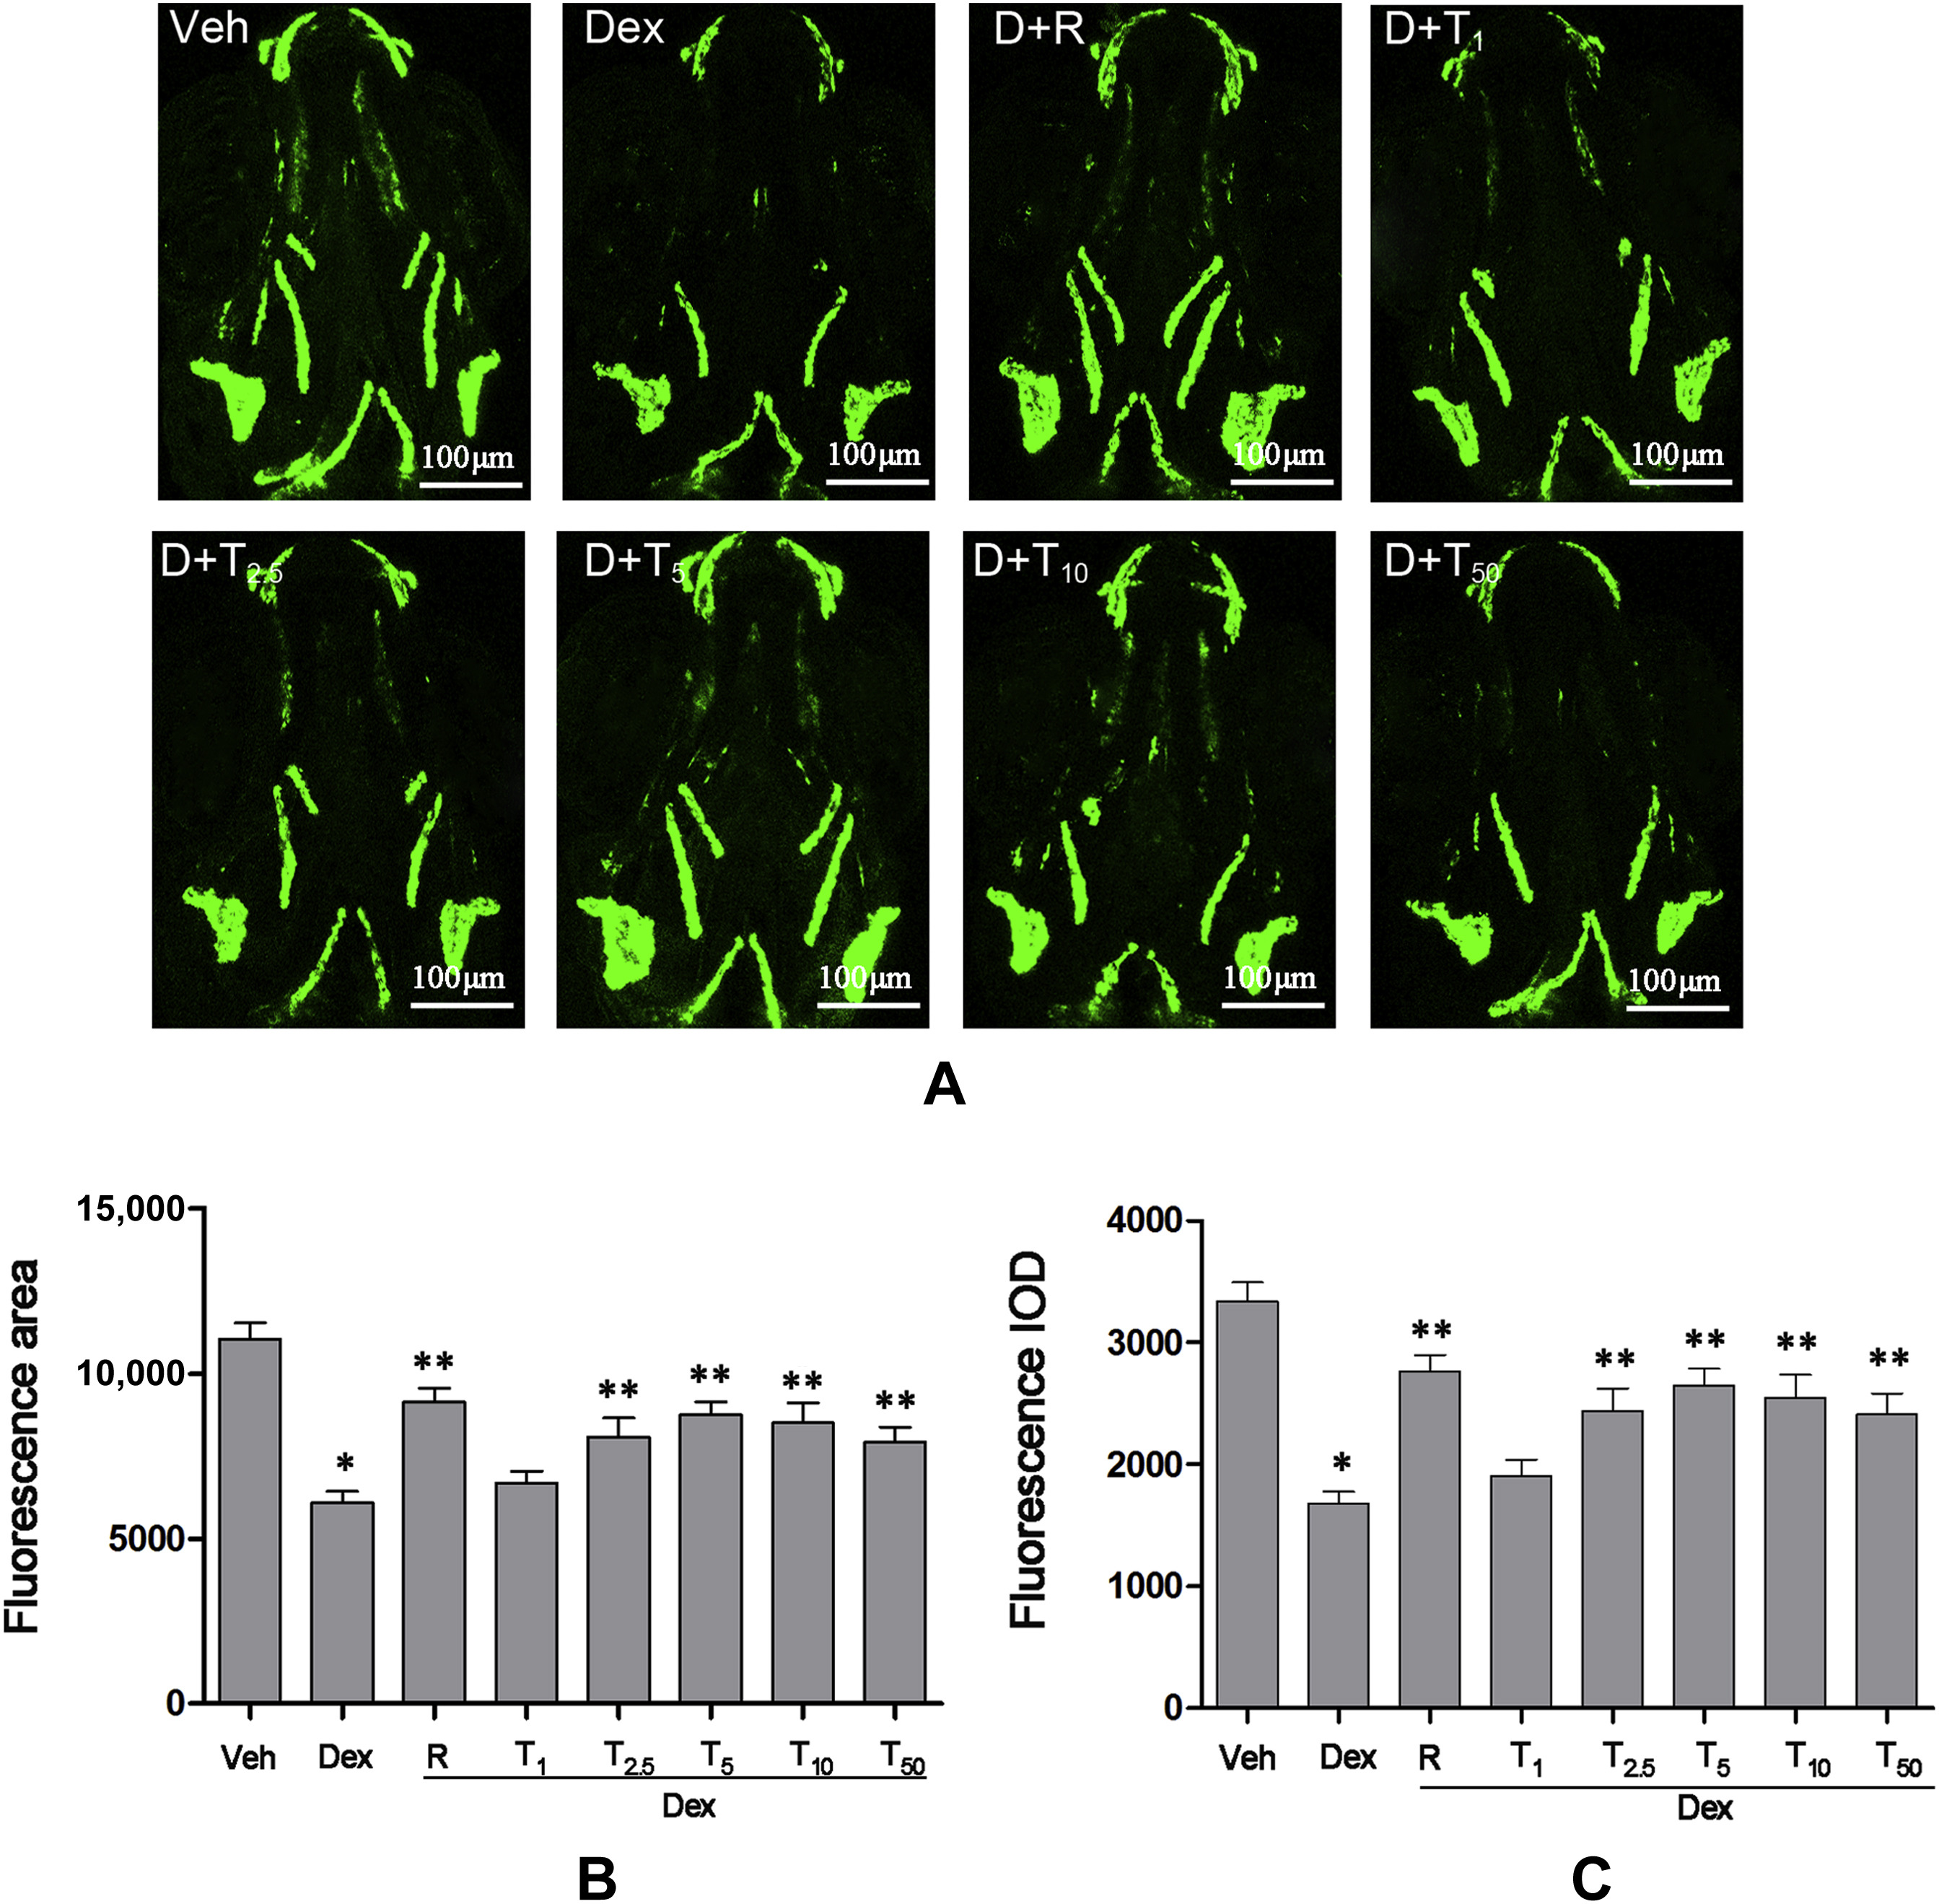
Fig. 5
Protective effects of tanshinol counteracting dexamethasone (Dex)-induced inhibition of osteoblasts differentiation in tg(sp7:egfp) zebrafish larvae. (A) Fluorescence images of the dorsal aspect measured with laser scanning confocal microscopy in tg(sp7:egfp) zebrafish larvae at 9 days' post fertilisation (dpf) exposure to Dex (10μM) in the presence or absence of tanshinol. (B) Effect of tanshinol on fluorescence area in 9-dpf tg (sp7:egfp) zebrafish exposed to Dex. (C) Effect of tanshinol on fluorescence integral optical density in 9-dpf tg (sp7:egfp) zebrafish exposed to Dex. Dex = Dexamethasone 10μM; D+R = Dex + rocalirol 6 × 10⁻⁶ μg/mL; D+T1 = Dex + tanshinol 1μM; D+T2.5 = Dex + tanshinol 2.5μM; D+T5 = Dex + tanshinol 5μM; D+T10 = Dex + tanshinol 10μM; D+T50 = Dex + tanshinol 50μM; IOD = integral optical density; Veh = vehicle control, 0.1% dimethyl sulphoxide. Data are given as mean ± standard deviation (n ≥ 9). *p < 0.05 versus vehicle control. **p < 0.05 versus Dex treatment.