
|
Fig. S4
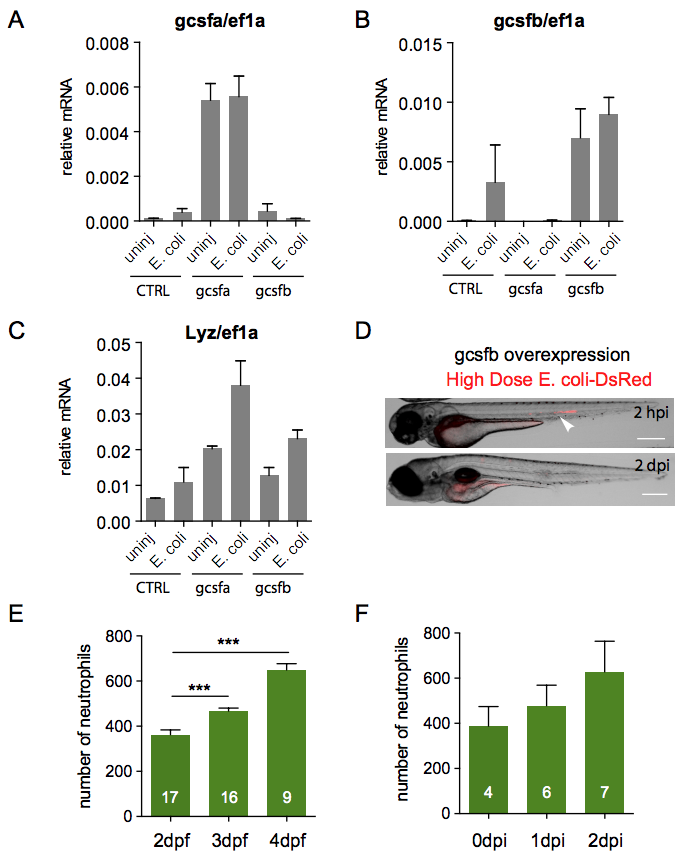
gcsfa, gcsfb and lyz expressions upon injection of gcsfa and gcsfb plasmids in zebrafish embryos and effects of gcsfb overexpression during notochord infection.
qRT-PCR of gcsfa (A), gcsfb (B) and lyz (C) mRNAs relative to ef1a in wild type larvae or in larvae expressing a gcsfa- or gcsfb- transgenes. Embryos were either uninjected (CTRL) or injected with a gcsfa- or gcsfb-overexpressing plasmid at one cell-stage. They were subsequently either uninfected or infected with E. coli in the notochord at 2 dpf. RNA was extracted from whole larvae at 1–2 dpi (6 larvae per pool, mean ± SEM, N = 2–4). (D-F) Two dpf tg(mpx:GFP) embryos overexpressing gcsfb were either uninjected or infected in the notochord with a high dose of fluorescent E. coli-DsRed (>4000 CFU). (D) Larvae images are representative overlays of fluorescence (E. coli) and transmitted light images at 2 hpi and 2 dpi, showing the disappearance of bacteria at 2 dpi. Arrowhead shows the injection site. Scale bars = 400μm (Nlarvae = 6). (E-F) Quantification of neutrophil population at 2, 3 and 4 dpf in uninfected larvae (E) and at 0, 1 and 2 dpi in E. coli infected larvae (F) (Mann-Whitney test, two-tailed, Nlarvae is indicated on the columns, ***p<0.001).