
|
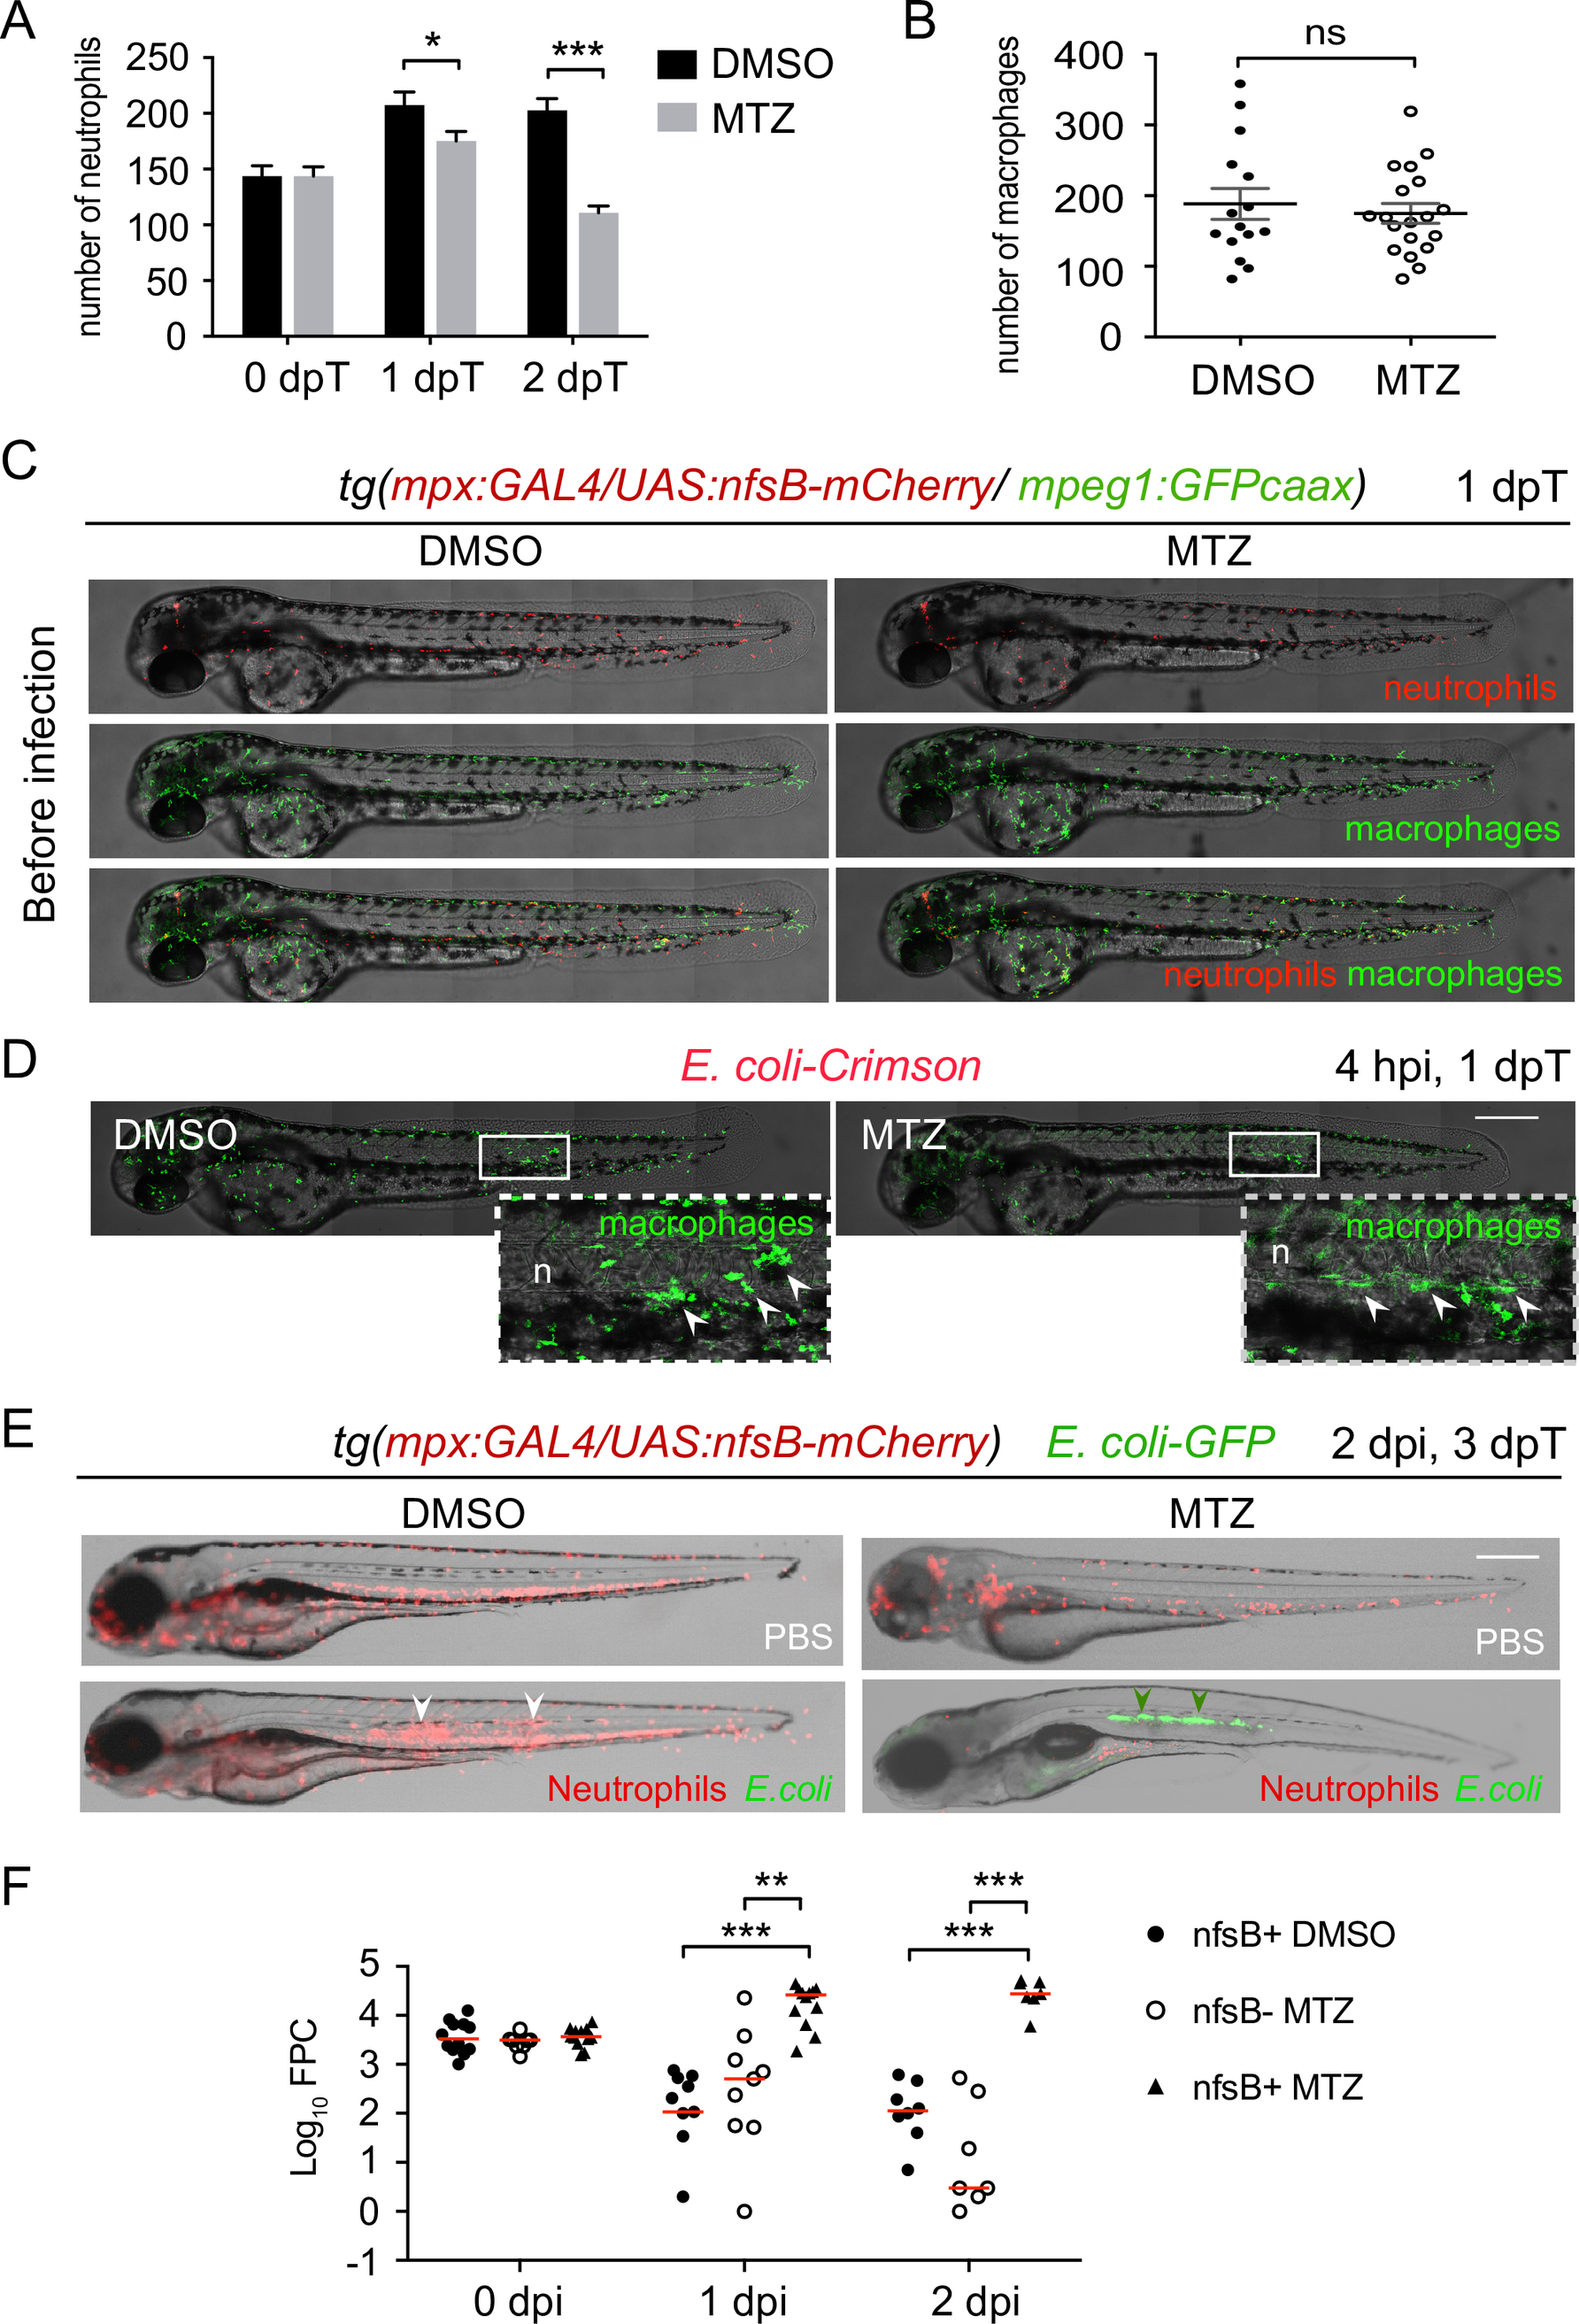
Fig. 3
Neutrophil ablation using Nitroreductase/Metronidazole system leads to bacterial growth during notochord infection.
(A-B-C-D) Tg(mpx:Gal4/UAS:nfsB-mCherry/mpeg1:GFPcaax) embryos were treated with DMSO or MTZ at 40 hpf and imaged at 0, 1 and 2 days post-treatment (dpT) with fluorescence microscopy. (A) Quantification of total neutrophils in DMSO and MTZ treated larvae at 0 and 1 and 2 dpT (mean number of neutrophils per larva ± SEM, Student’s test, one-tailed, *p<0.05, ***p<0.001, NDMSO = 21, NMTZ = 13–23). (B) Quantification of total macrophages in DMSO and MTZ treated larvae at 1 dpT (horizontal lines indicate mean values ± SEM, two independent experiments, Student’s test, two-tailed, ns: not significant, p>0.05, NDMSO = 15, NMTZ = 19). (C-D) Transgenic embryos were infected with E. coli-crimson in the notochord one day after MTZ treatment and imaged (C) before infection and (D) at 4 hpi with Spinning Disk confocal microscopy. (C) Representative overlay of maximum projections of montage acquisitions (mCherry and GFPcaax) with transmitted light images show neutrophil and macrophage distribution in DMSO and MTZ treated larvae before infection and (D) macrophage recruitment (arrowheads) at 4 hpi to the notochord (n). White boxes are zoomed areas. Similar results were obtained with 5 and 10 mM MTZ. (E) Tg(mpx:Gal4/UAS:nfsB-mCherry) embryos were treated with MTZ at 40 hpf and, at 3 dpf, larvae were injected either with PBS or E. coli-GFP in the notochord. The outcome of the infection was analysed by fluorescent microscopy. Larva images are representative overlays of fluorescence and transmitted light images at 2 dpi. In the absence of MTZ, neutrophils are massively recruited to the notochord and E. coli is cleared (white arrowheads). In MTZ-treated larvae, E. coli (green arrowheads) grow heavily. Scale bars: 400 μm. (F) Bacterial load quantification by Fluorescent Pixel Count (FPC) in MTZ treated Tg(mpx:Gal4/UAS:nfsB-mCherry) (nfsB+ MTZ) at 0, 1 and 2 dpi showing significant differences in the bacterial load with control groups (Tg(mpx:Gal4/UAS:nfsB-mCherry) treated with DMSO referred as nfsB+ DMSO and non transgenic siblings treated with MTZ referred as nfsB- MTZ) (horizontal bars indicate the median, Kruskall-Wallis test with Dunn’s post-test, **p<0.01, ***p<0.001, NnfsB+ DMSO = 9–12, NnfsB- MTZ = 8–9, NnfsB+ MTZ = 7–12).