
|
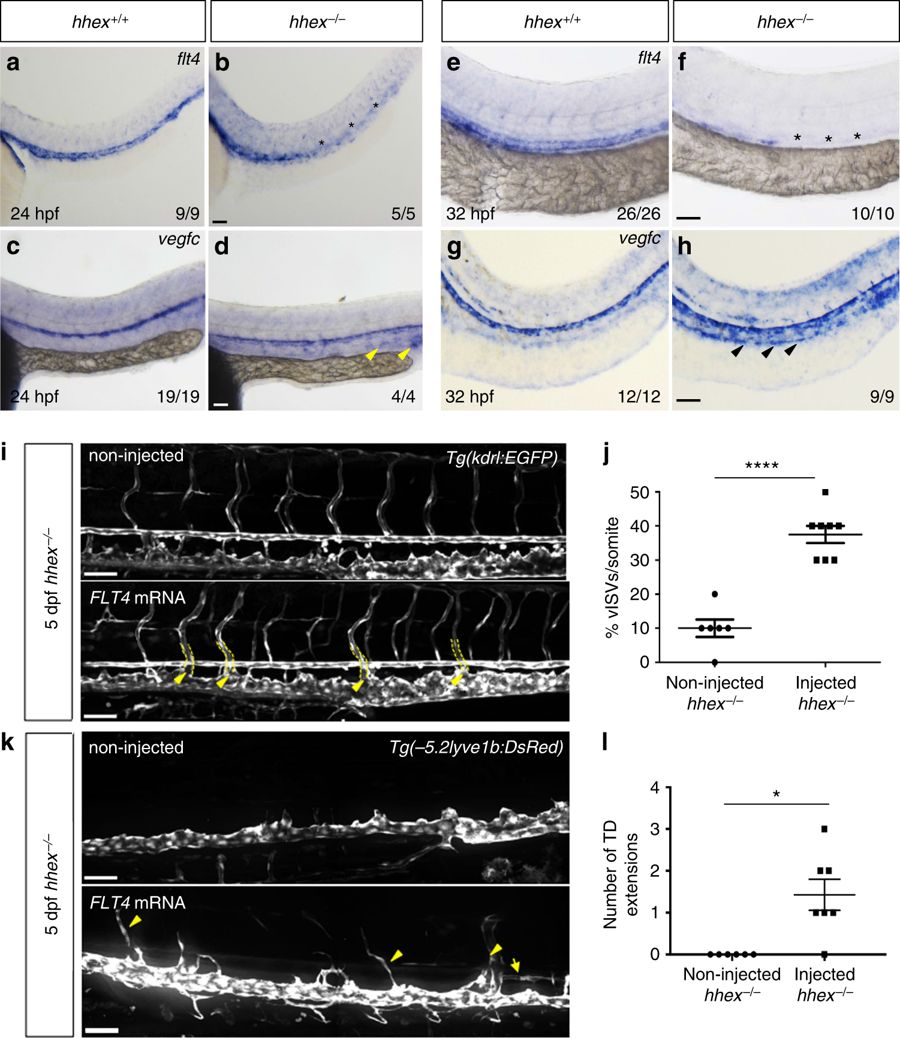
Fig. 2
The Vegfc/Flt4 pathway is affected in zebrafish hhex mutants. a–d Whole-mount in situ hybridization showing flt4 (a, b) and vegfc (c, d) expression in 24 hpf hhex+/+ and hhex−/− embryos. At 24 hpf, hhex mutants exhibit decreased flt4 expression (asterisks), whereas vegfc expression in the PCV appears to be slightly increased (arrowheads). e–h Whole-mount in situ hybridization showing flt4 (e, f) and vegfc (g, h) expression at 32 hpf in hhex+/+ and hhex−/− embryos. At 32 hpf, hhex mutants exhibit a strong decrease in flt4 expression (asterisks), whereas vegfc expression is clearly increased in the PCV (arrowheads). x/y: number of embryos showing representative phenotype (x), number of embryos examined (y). i Trunk vasculature of 5 dpf Tg(kdrl:EGFP); hhex−/− injected, or not, with full-length human FLT4 mRNA. hhex mutants exhibit partial rescue of their vISVs at 5 dpf (arrowheads point to vISVs). j Quantification of vISVs across 10 somites in 5 dpf non-injected hhex−/− (n = 6) and FLT4 mRNA-injected hhex−/− (n = 8). k Trunk lymphatic vasculature of 5 dpf Tg(−5.2lyve1b:DsRed); hhex−/− injected, or not, with full-length human FLT4 mRNA. hhex mutants exhibit partial rescue of their TD at 5 dpf (arrowheads point to vISVs and arrow points to TD). l Quantification of TD extensions across 10 somites in 5 dpf non-injected hhex−/− (n = 6) and FLT4 mRNA-injected hhex−/− (n = 7). Values represent means ± s.e.m. ****P ≤ 0.0001 and *P ≤ 0.05 by t-test. Scale bars: 50 μm