
Image
|
Figure Caption
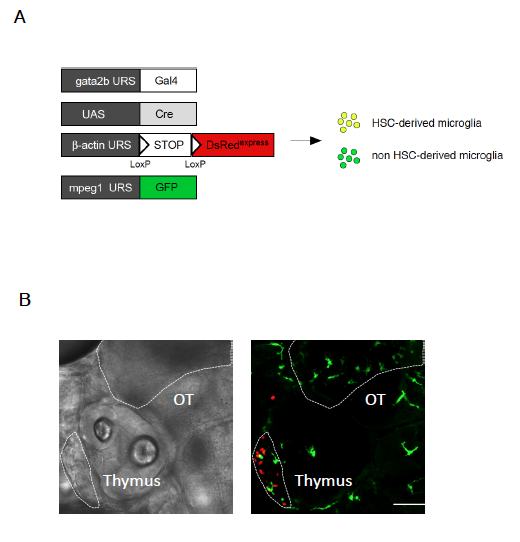
Fig. S6
Gata2b-Cre does not label embryonic microglia, related to Figure 6
(A) Schematic of the transgenic lines used to investigate the contribution of embryonic HSCs to microglia ontogeny
(B) Quadruple transgenic gata2b:Gal4; UAS:Cre; bactin:Switch-DsRed; mpeg1:GFP embryos were analyzed by confocal imaging at 5dpf. Shown are bright field (left panel) and GFP and DsRed merged images (right panel) of the head region. In the optic tectum (OT) area, mpeg1+ microglia only express GFP, while DsRed+ cells originating from HSCs are observed in the thymic anlage. Scale bar = 25μm.
Acknowledgments
This image is the copyrighted work of the attributed author or publisher, and
ZFIN has permission only to display this image to its users.
Additional permissions should be obtained from the applicable author or publisher of the image.
Full text @ Cell Rep.