
|
Fig. 4
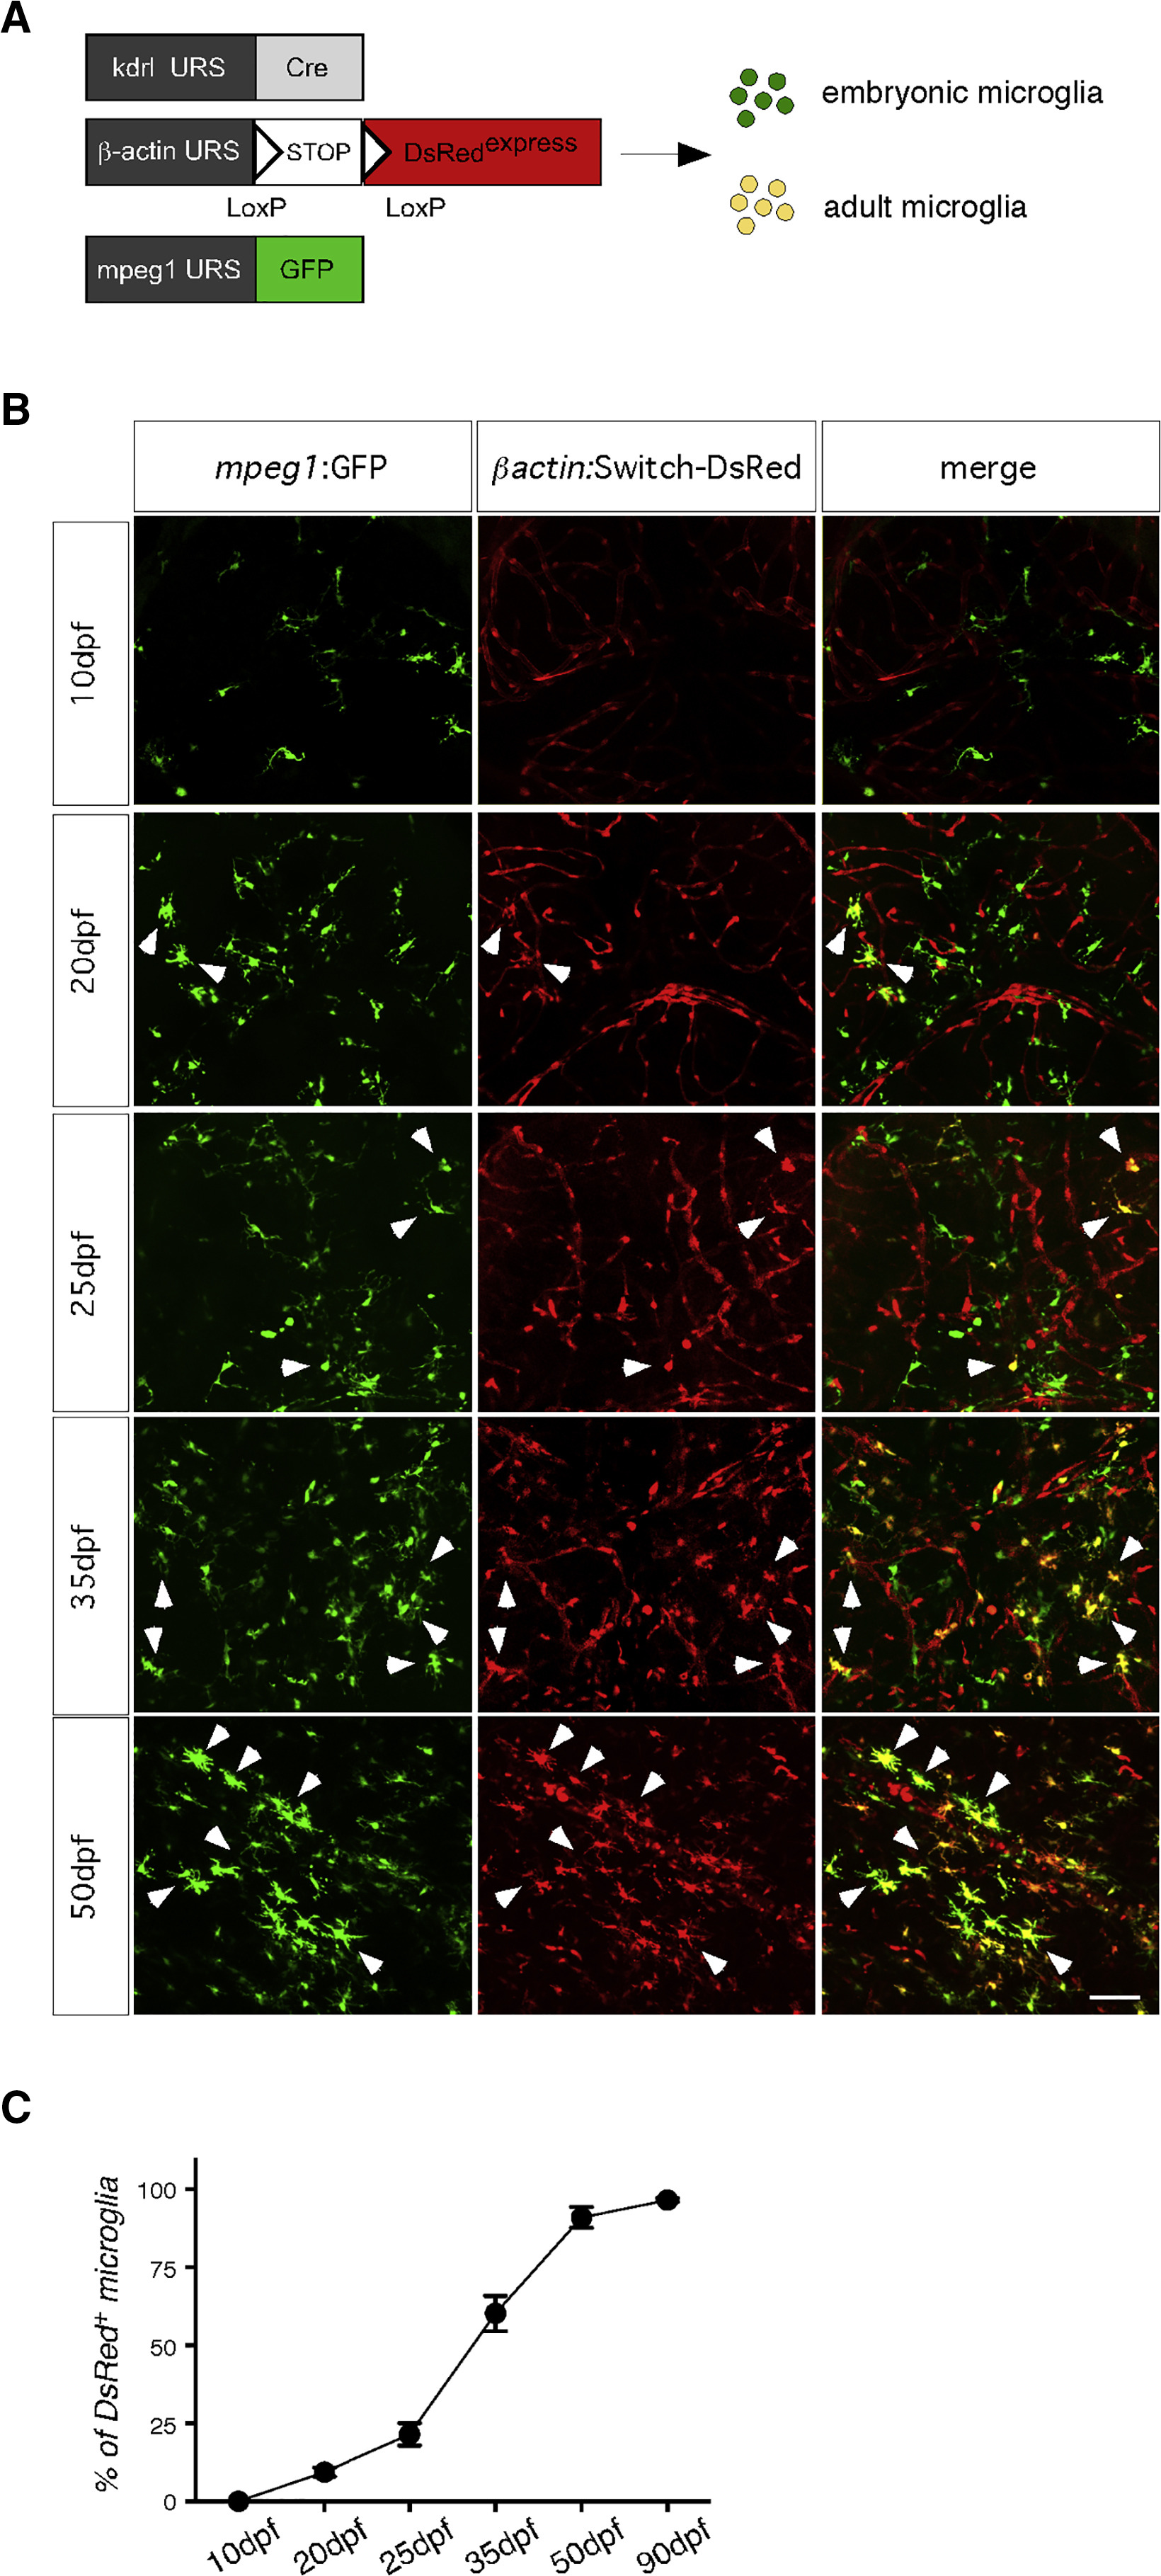
Kinetics of Adult MG Emergence during Zebrafish Development
(A) Scheme of the transgenic lines used to discriminate pMF-derived embryonic MG from endothelial-derived adult MG.
(B) GFP (left panels) and DsRed (middle panels) immunostaining performed on brain sections from Tg(kdrl:Cre; ßactin:Switch-DsRed; mpeg1:GFP) triple transgenics at the indicated developmental stage, showing the replacement of GFP+ DsRed− embryonic MG by GFP+ DsRed+ cells in the brain parenchyma. The right panels show a merge of both fluorescent channels. Scale bar: 50 μm.
(C) Quantification of DsRed+ MG in the brain parenchyma during zebrafish development, determined as percent recombination among the whole GFP+ MG population. Error bars represent mean ± SEM of pooled data from two experiments (n = 3). MG, microglia.