
Image
|
Figure Caption
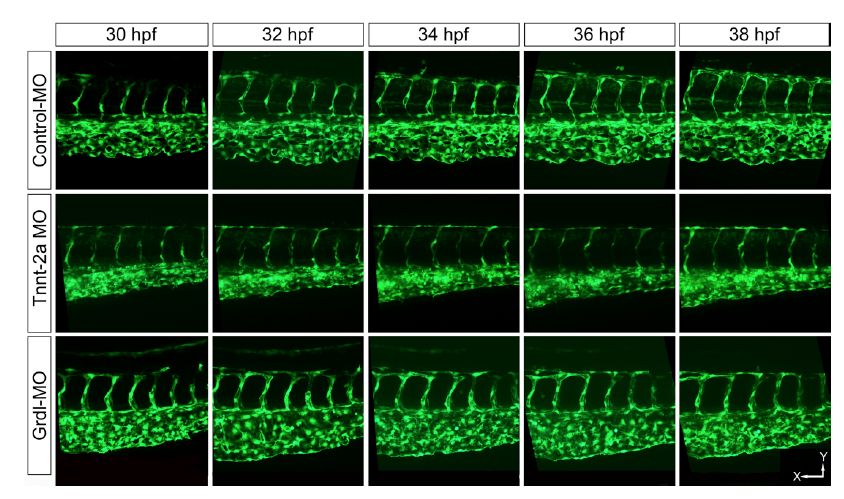
Fig. S6a
Morpholino (MO) antisense oligonucleotides microinjected CVP between 30-38 hpf. The control MO injected CVP shows normal CVP development, which remodels with time. While tnnt-2a and gridlock MO injected embryos show impaired CVP development along with the dramatically reduction in pillar formation. Scale bar x-axis = 50 μm; y-axis=32 μm. See also supplementary figure S3.
Acknowledgments
This image is the copyrighted work of the attributed author or publisher, and
ZFIN has permission only to display this image to its users.
Additional permissions should be obtained from the applicable author or publisher of the image.
Full text @ Sci. Rep.