
|
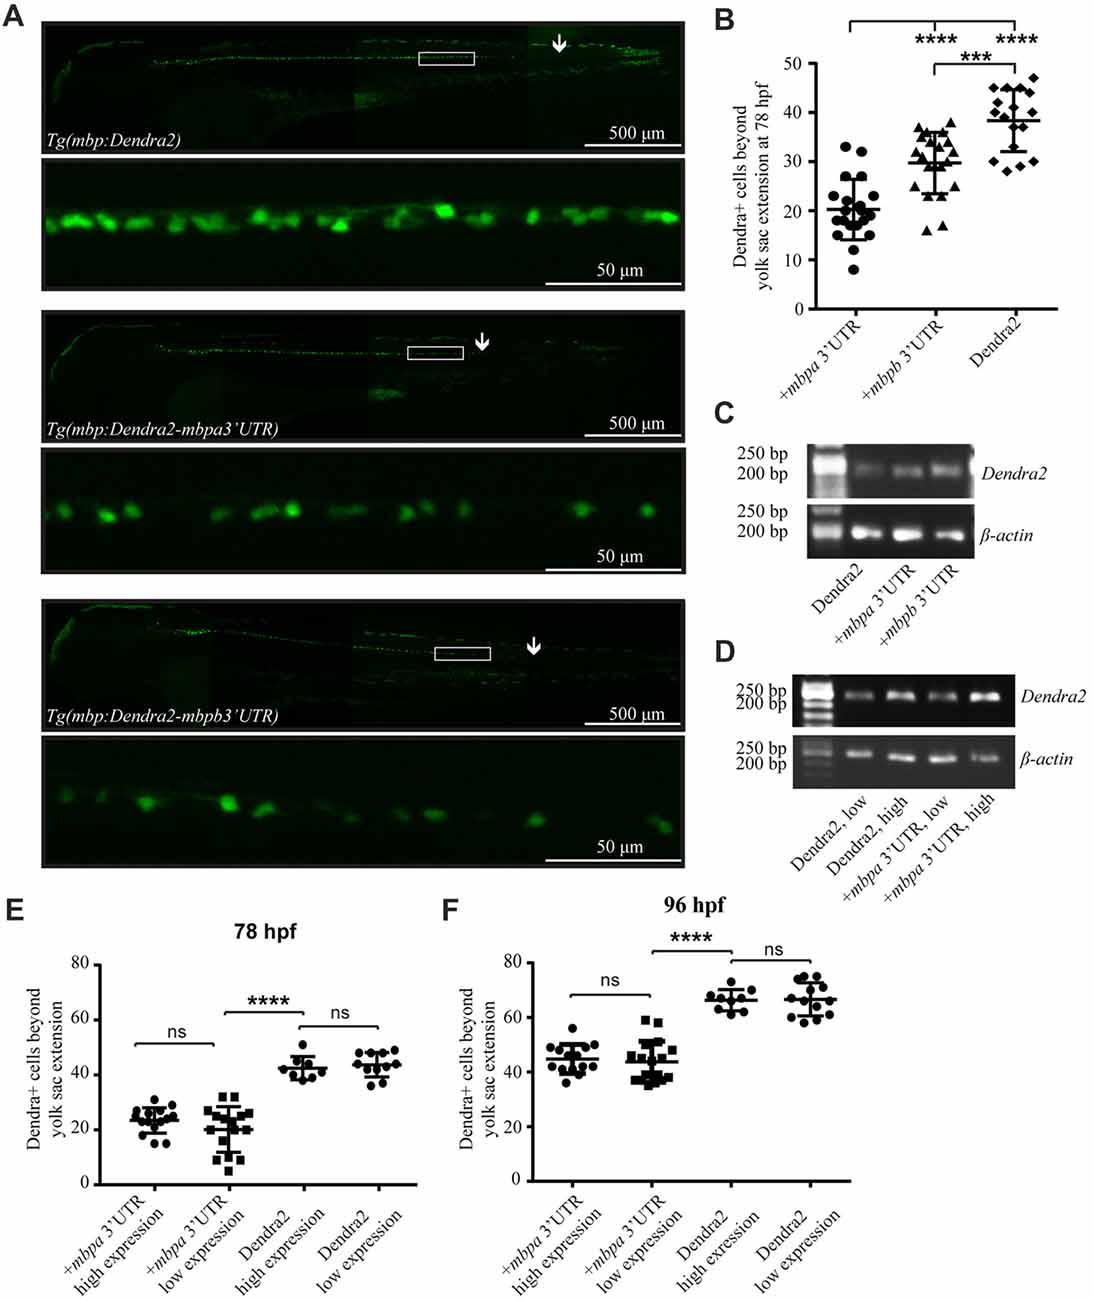
Fig. 5
The 3’UTRs from mbpa and mbpb inhibit protein translation in vivo. (A) Lateral views of representative full-size transgenic zebrafish at 78 hpf and magnifications of the boxed areas. The most posteriorly located Dendra2-positive cell in each fish is marked with an arrow. (B) The number of Dendra2-positive cells caudal to the yolk sac extension was counted at 78 hpf. At least 17 fish were analyzed from each strain. (C) RT-PCR with RNA extracted from transgenic zebrafish larvae at 78 hpf as template. Primers recognized Dendra2 or β-actin (control). (D) RT-PCR with RNA extracted from transgenic zebrafish larvae grouped into “low expression” and “high expression” based on fluorescent intensity at 78 hpf as template. Primers recognized Dendra2 or β-actin (control) (E,F) The number of Dendra2-positive cells caudal to the yolk sac extension in transgenic larvae sorted based on the intensity of fluorescence in individual cells at 78 (D) or 96 (E) hpf. 8–16 fish were analyzed for each group. Results are shown ± SD. ns = not significant, ***p < 0.001, ****p < 0.0001.