
|
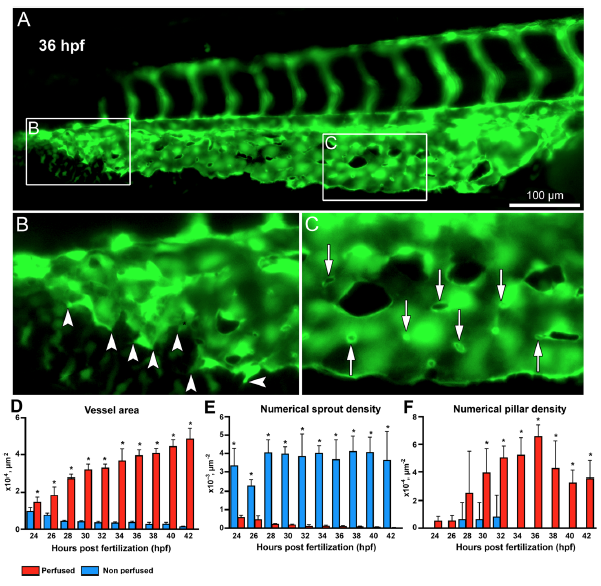
Fig. 2
Morphometric analysis of sprouting vs.intussusceptive angiogenesis between perfused and non-perfused regions of the zebrafish CVP. (A) At 36 hpf the zebrafish embryo shows both intussusceptive and sprouting angiogenesis. (B) The box B in the distal region of the CVP is marked to show the sprouts in the non-perfused region with the arrowheads pointing to the corresponding enlarged image. (C) The box C in the proximal region of the CVP shows the pillars in the perfused region marked with white arrows in the corresponding enlarged image. (D) The bar graph represents the vessel area (VA) of the zebrafish CVP, the VA in the perfused region is significantly (p < 0.05) increased in comparison with the non-perfused region. (E) The numerical sprout density (i.e. number of sprouts/vessel area) is significantly (p < 0.05) increased in the non-perfused region compared to the perfused region. (F) While the numerical pillar density (i.e. number of pillars/vessel area) increases with time reaching the maximum pillar density at 36 hpf and subsequently decreases due to pillar fusion and splitting, the values represented in the graph are mean ± SD (n = 4). Asterisks (*) indicate significant increase.