
|
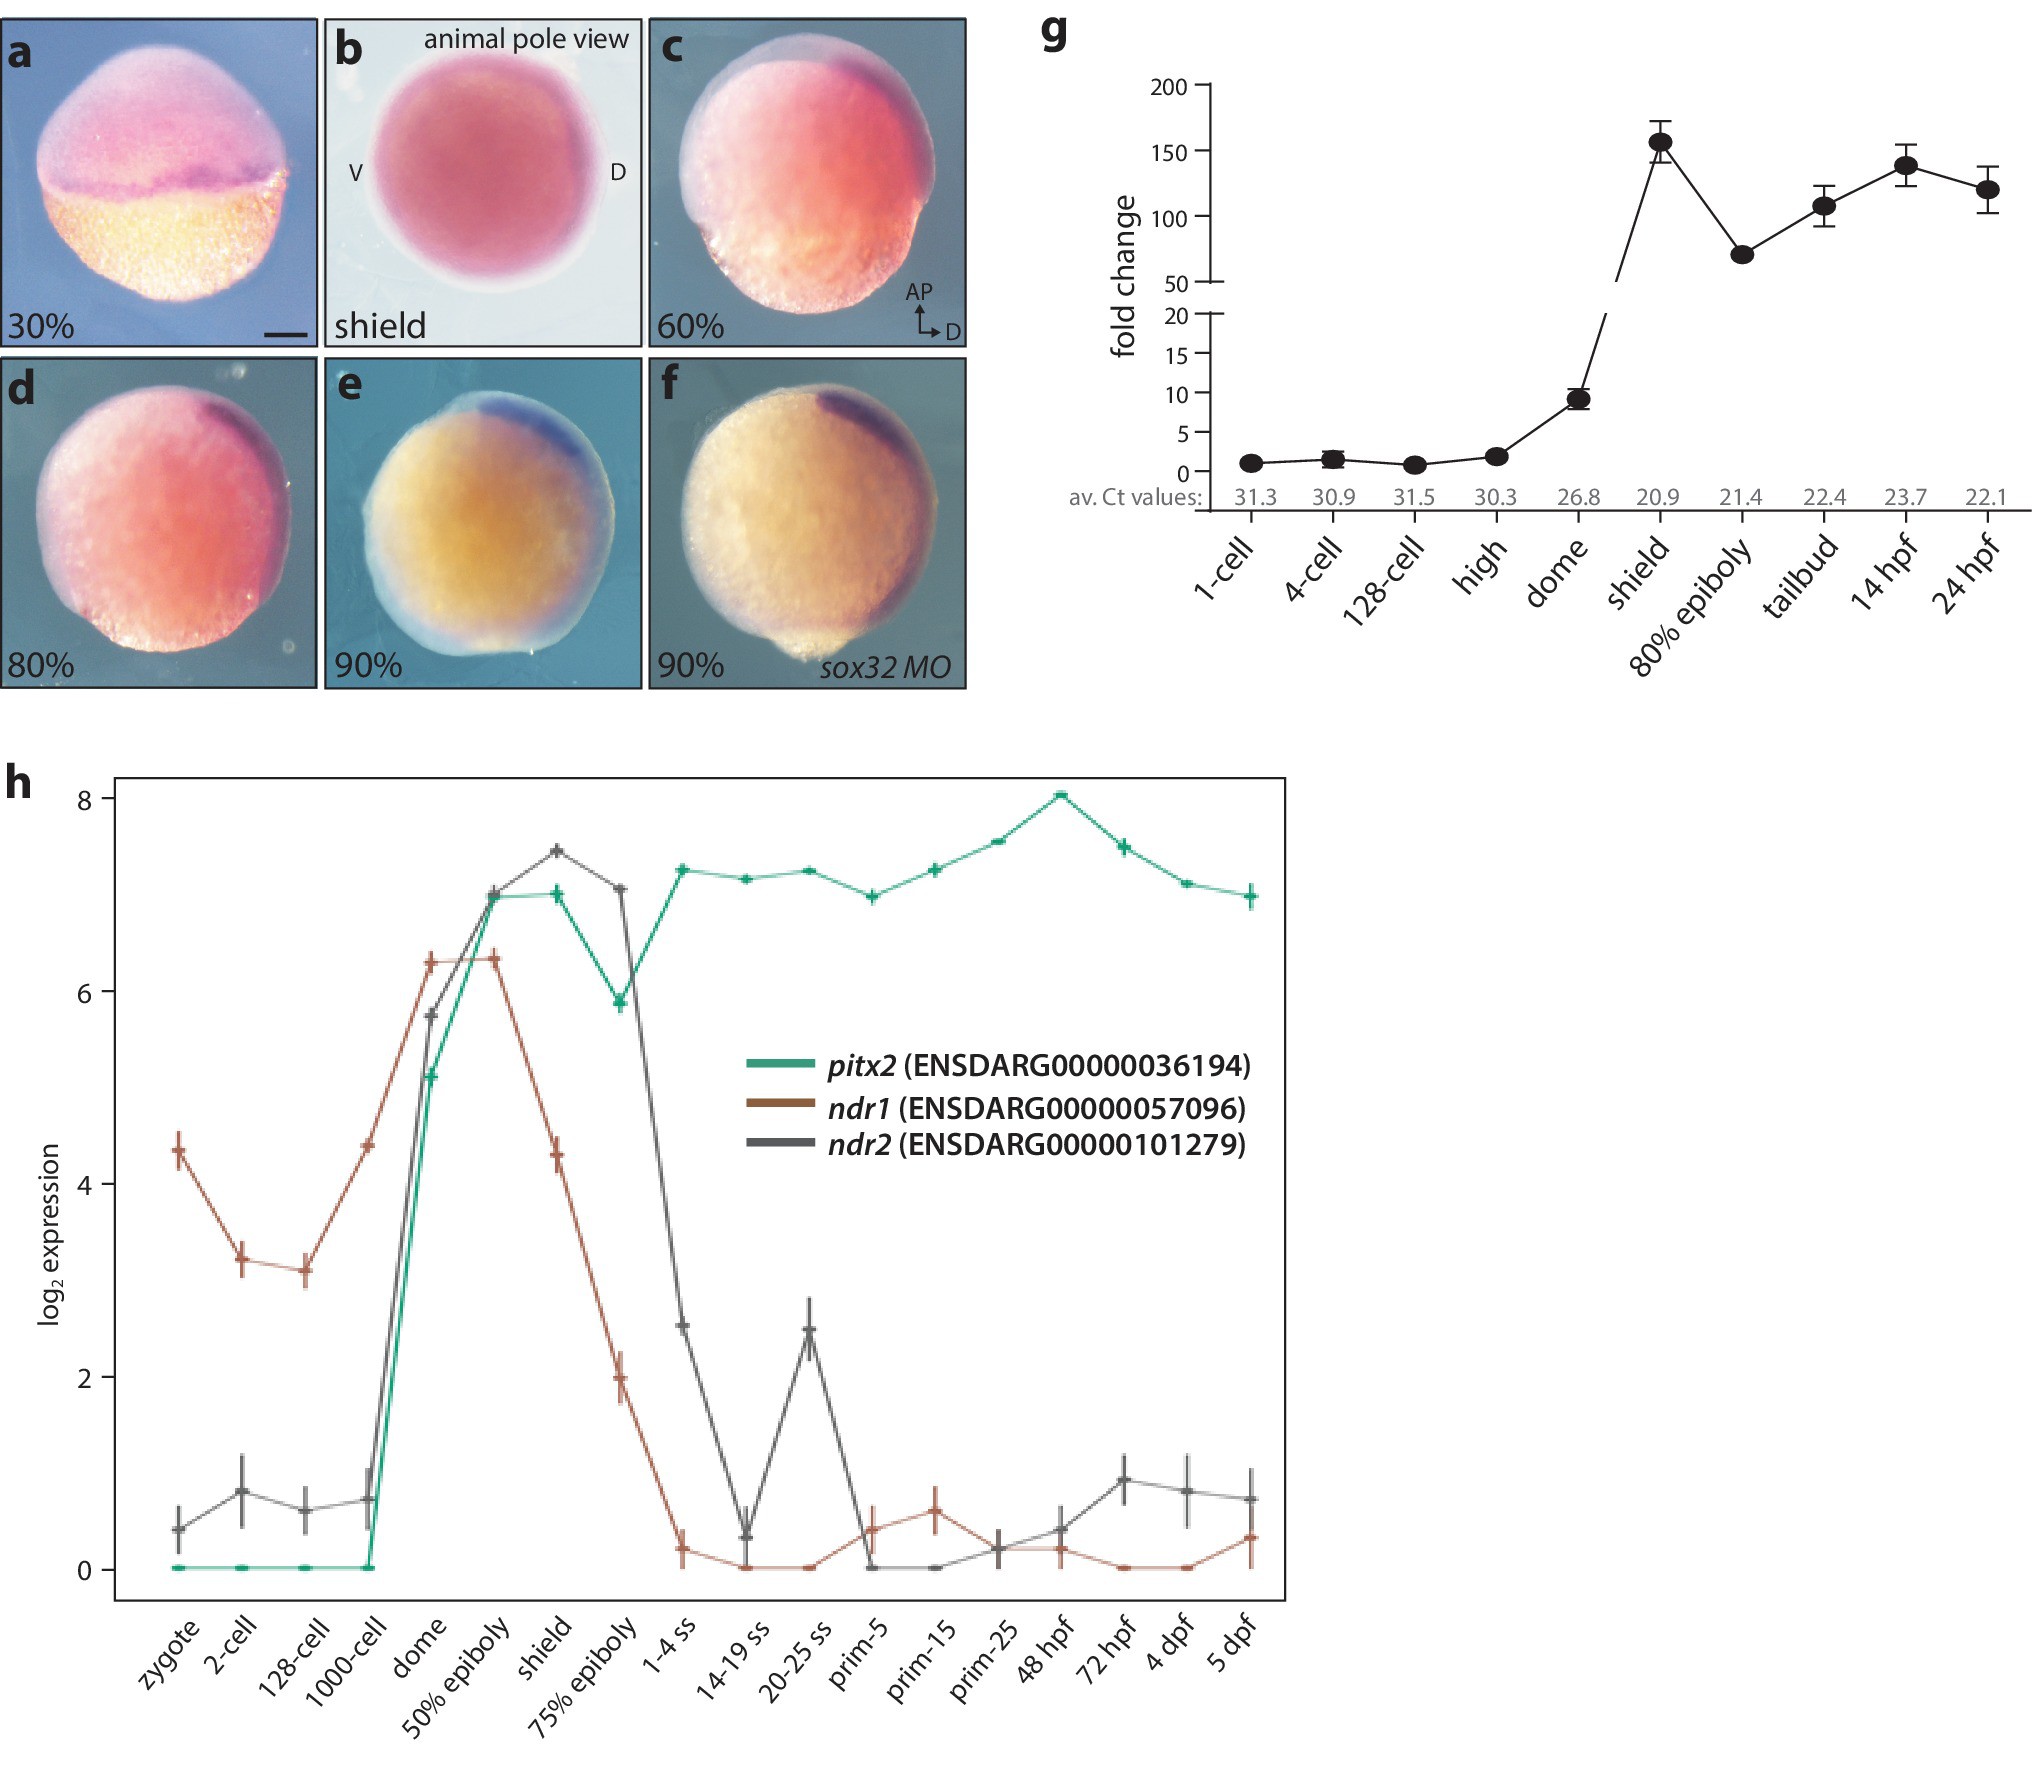
Fig. 1-S1
Maternal and zygotic expression of pitx2c.
(a–h) Analysis of the pitx2c mRNA expression pattern from the 2 cell stage to 90% epiboly by in situ hybridization (a–f) and qPCR (g) reveals low levels of maternal contribution followed by an increase throughout gastrulation and somitogenesis. qPCR was performed using primers F2 and R2 (Figure 1a). Average Ct values obtained at each stage are indicated in grey at the bottom of the graph. At the onset of gastrulation, pitx2c expression is detected at the margin (a, b). Expression of pitx2c at 90% epiboly in wild-type embryos (e) and embryos lacking endoderm (sox32 morphants) (f) is indistinguishable, indicating that pitx2c is mainly expressed in mesodermal cells. (h) Database analysis of Ensembl-curated transcriptomic resources showing log2-fold change in expression level for pitx2 (green line) and two nodal genes, ndr1 (brown line) and ndr2 (gray line). Very low levels (<5 RPKM) of pitx2c transcript are reported in available RNAseq datasets at the 1 cell to 1000 cell stage. qPCR analysis for pitx2c expression (g) reflects the dynamic expression reported in available transcriptomic databases (h). b: animal pole view, dorsal to the right; c-f: lateral views, dorsal to the right. Scale bar, 100 μm.