
|
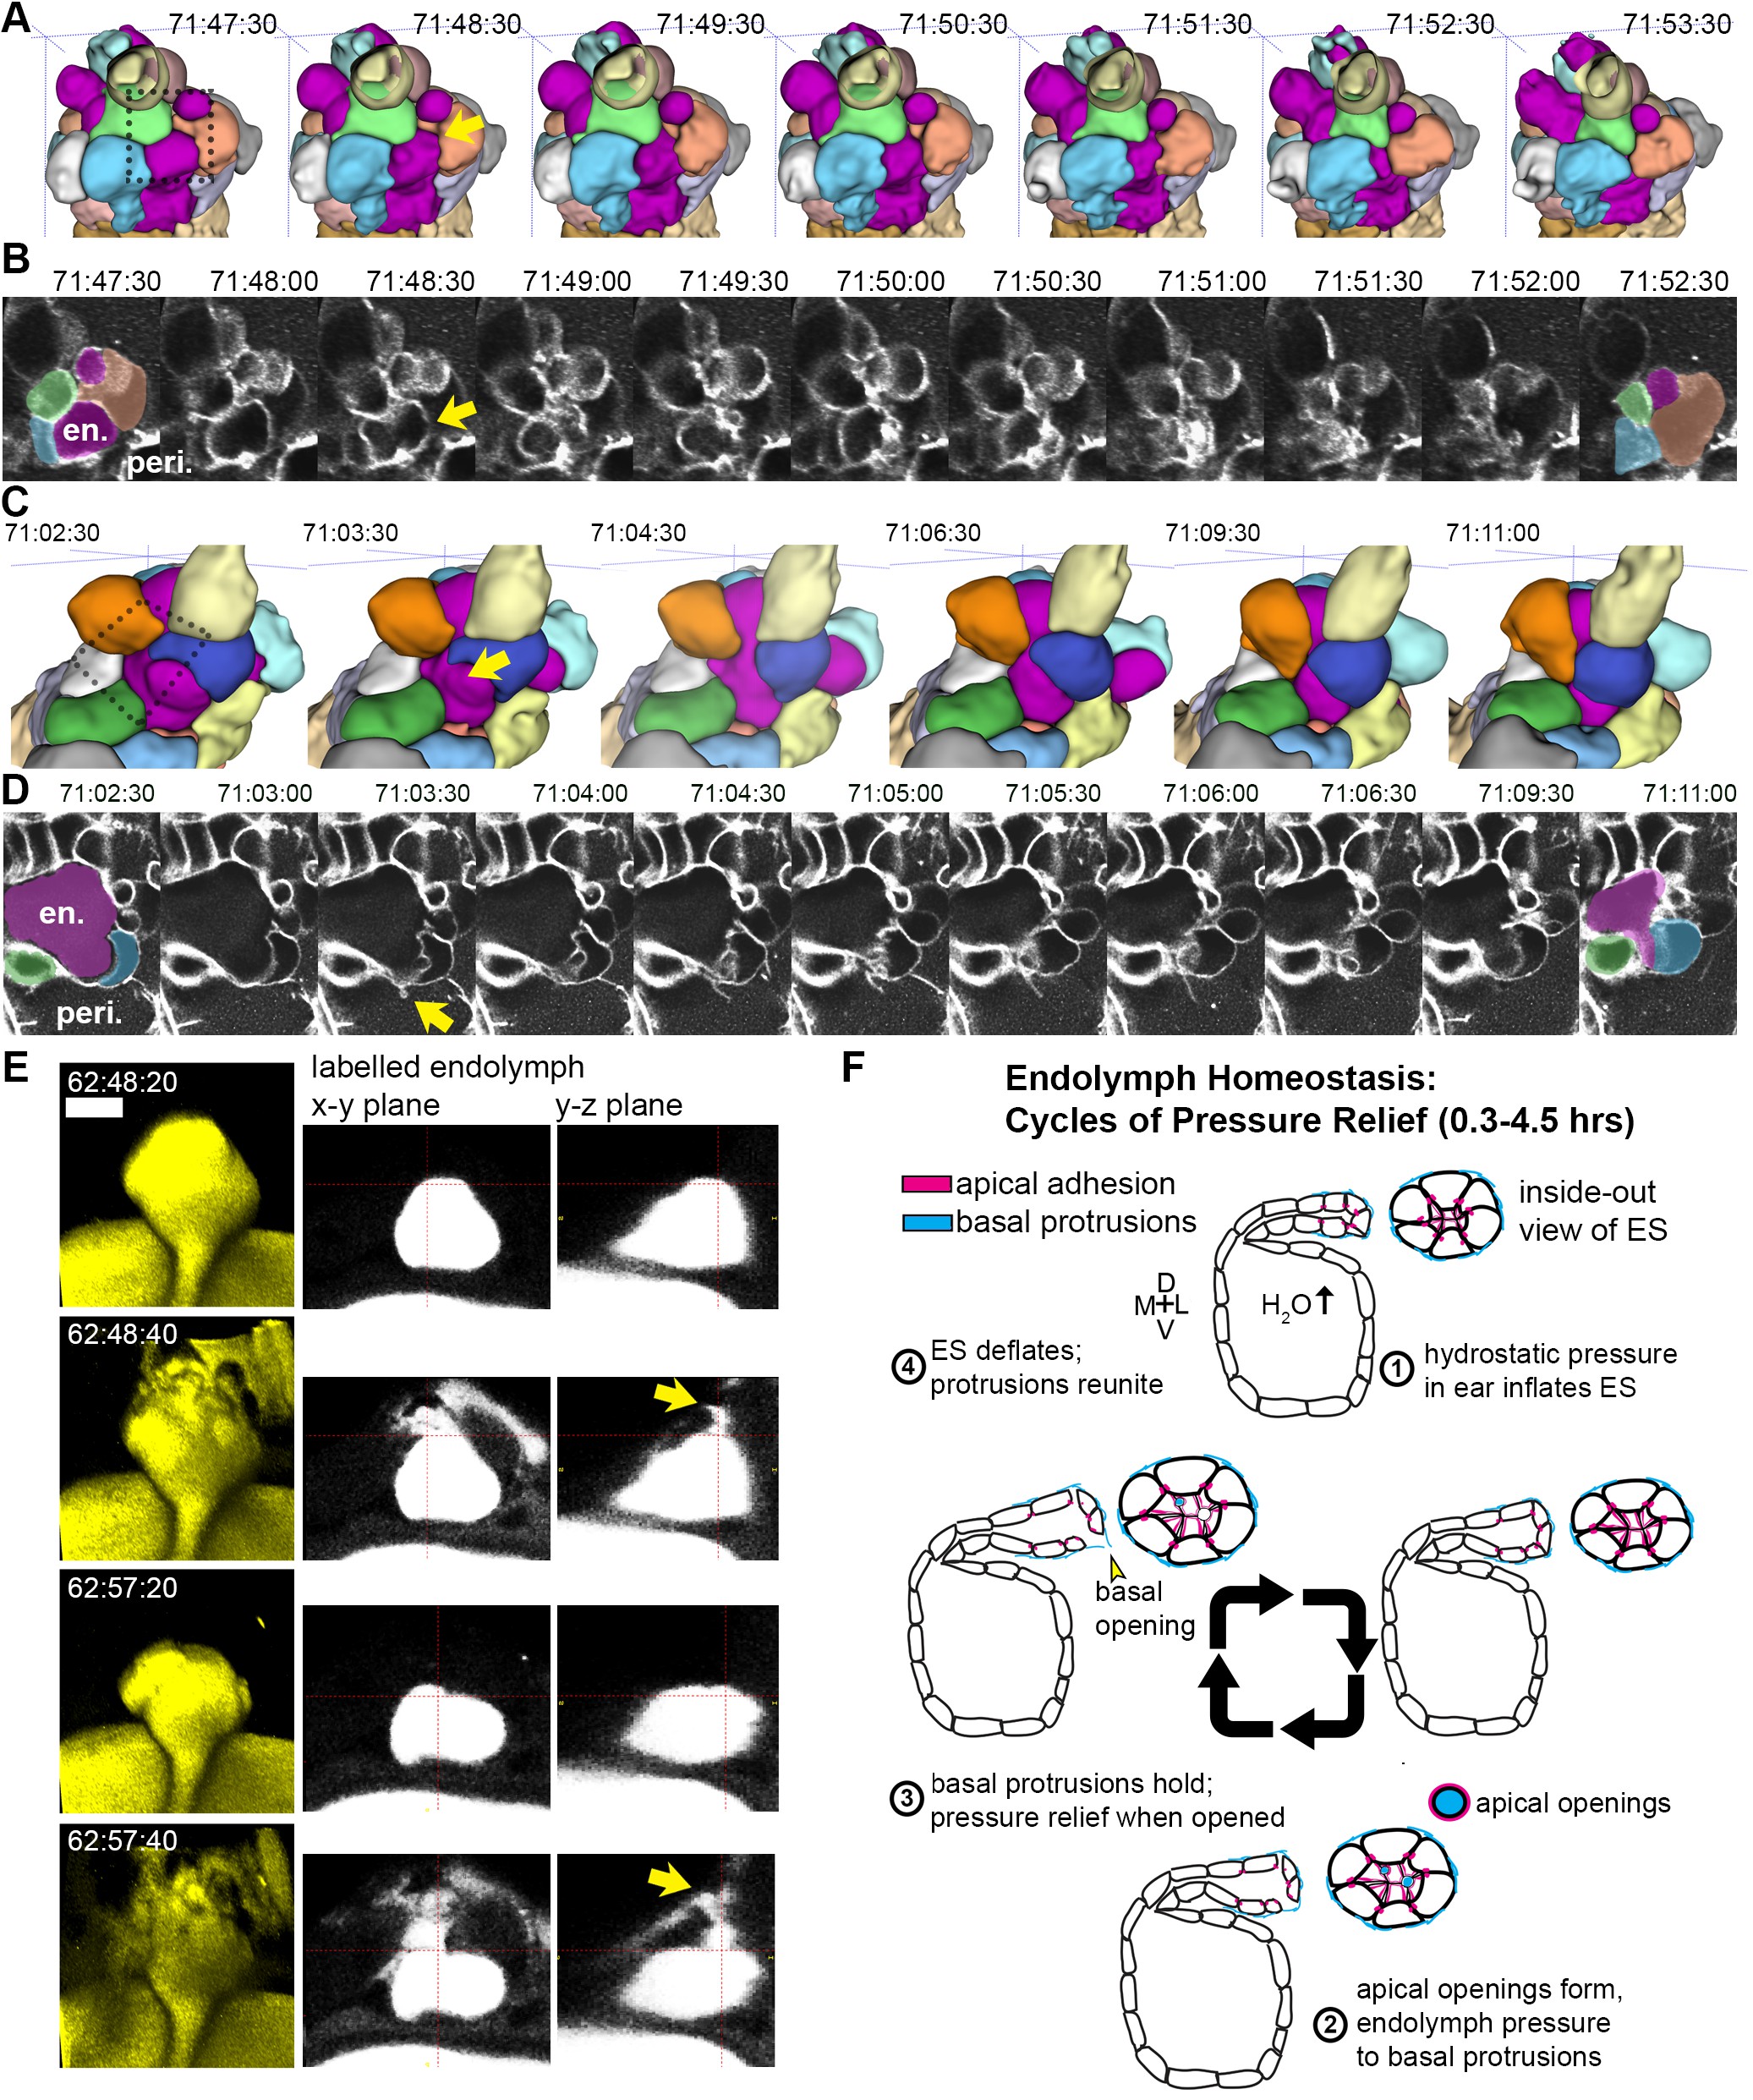
Fig. 7
Basal lamellae open prior to deflation.
(A,C) 3D renderings of segmented cells and ES lumen. (A) Dorsal view. (B) Raw data of membrane citrine AO-LLSM data spanning same time range as in (A). First and last time point are overlaid with segmentations for cells and lumen (magenta) neighboring the region of valve opening. In (A–D) arrows point to site of lamellae separating, dotted outlines indicate field of views in B and D, en. indicates endolymph lumen, peri. indicates perilymph. (C) Anterior view of another instance of lamellae separating. (D) Raw data spanning time range of (C). (E) Dorsal view of endolymph volume within ES lumen and time points before and after two release events. Middle and right panels show x-y and y-z ortho-planes of the isolated release sites, highlighted with yellow arrows (See Video 14), n = 8 (F) Illustrated pressure relief mechanism.