
|
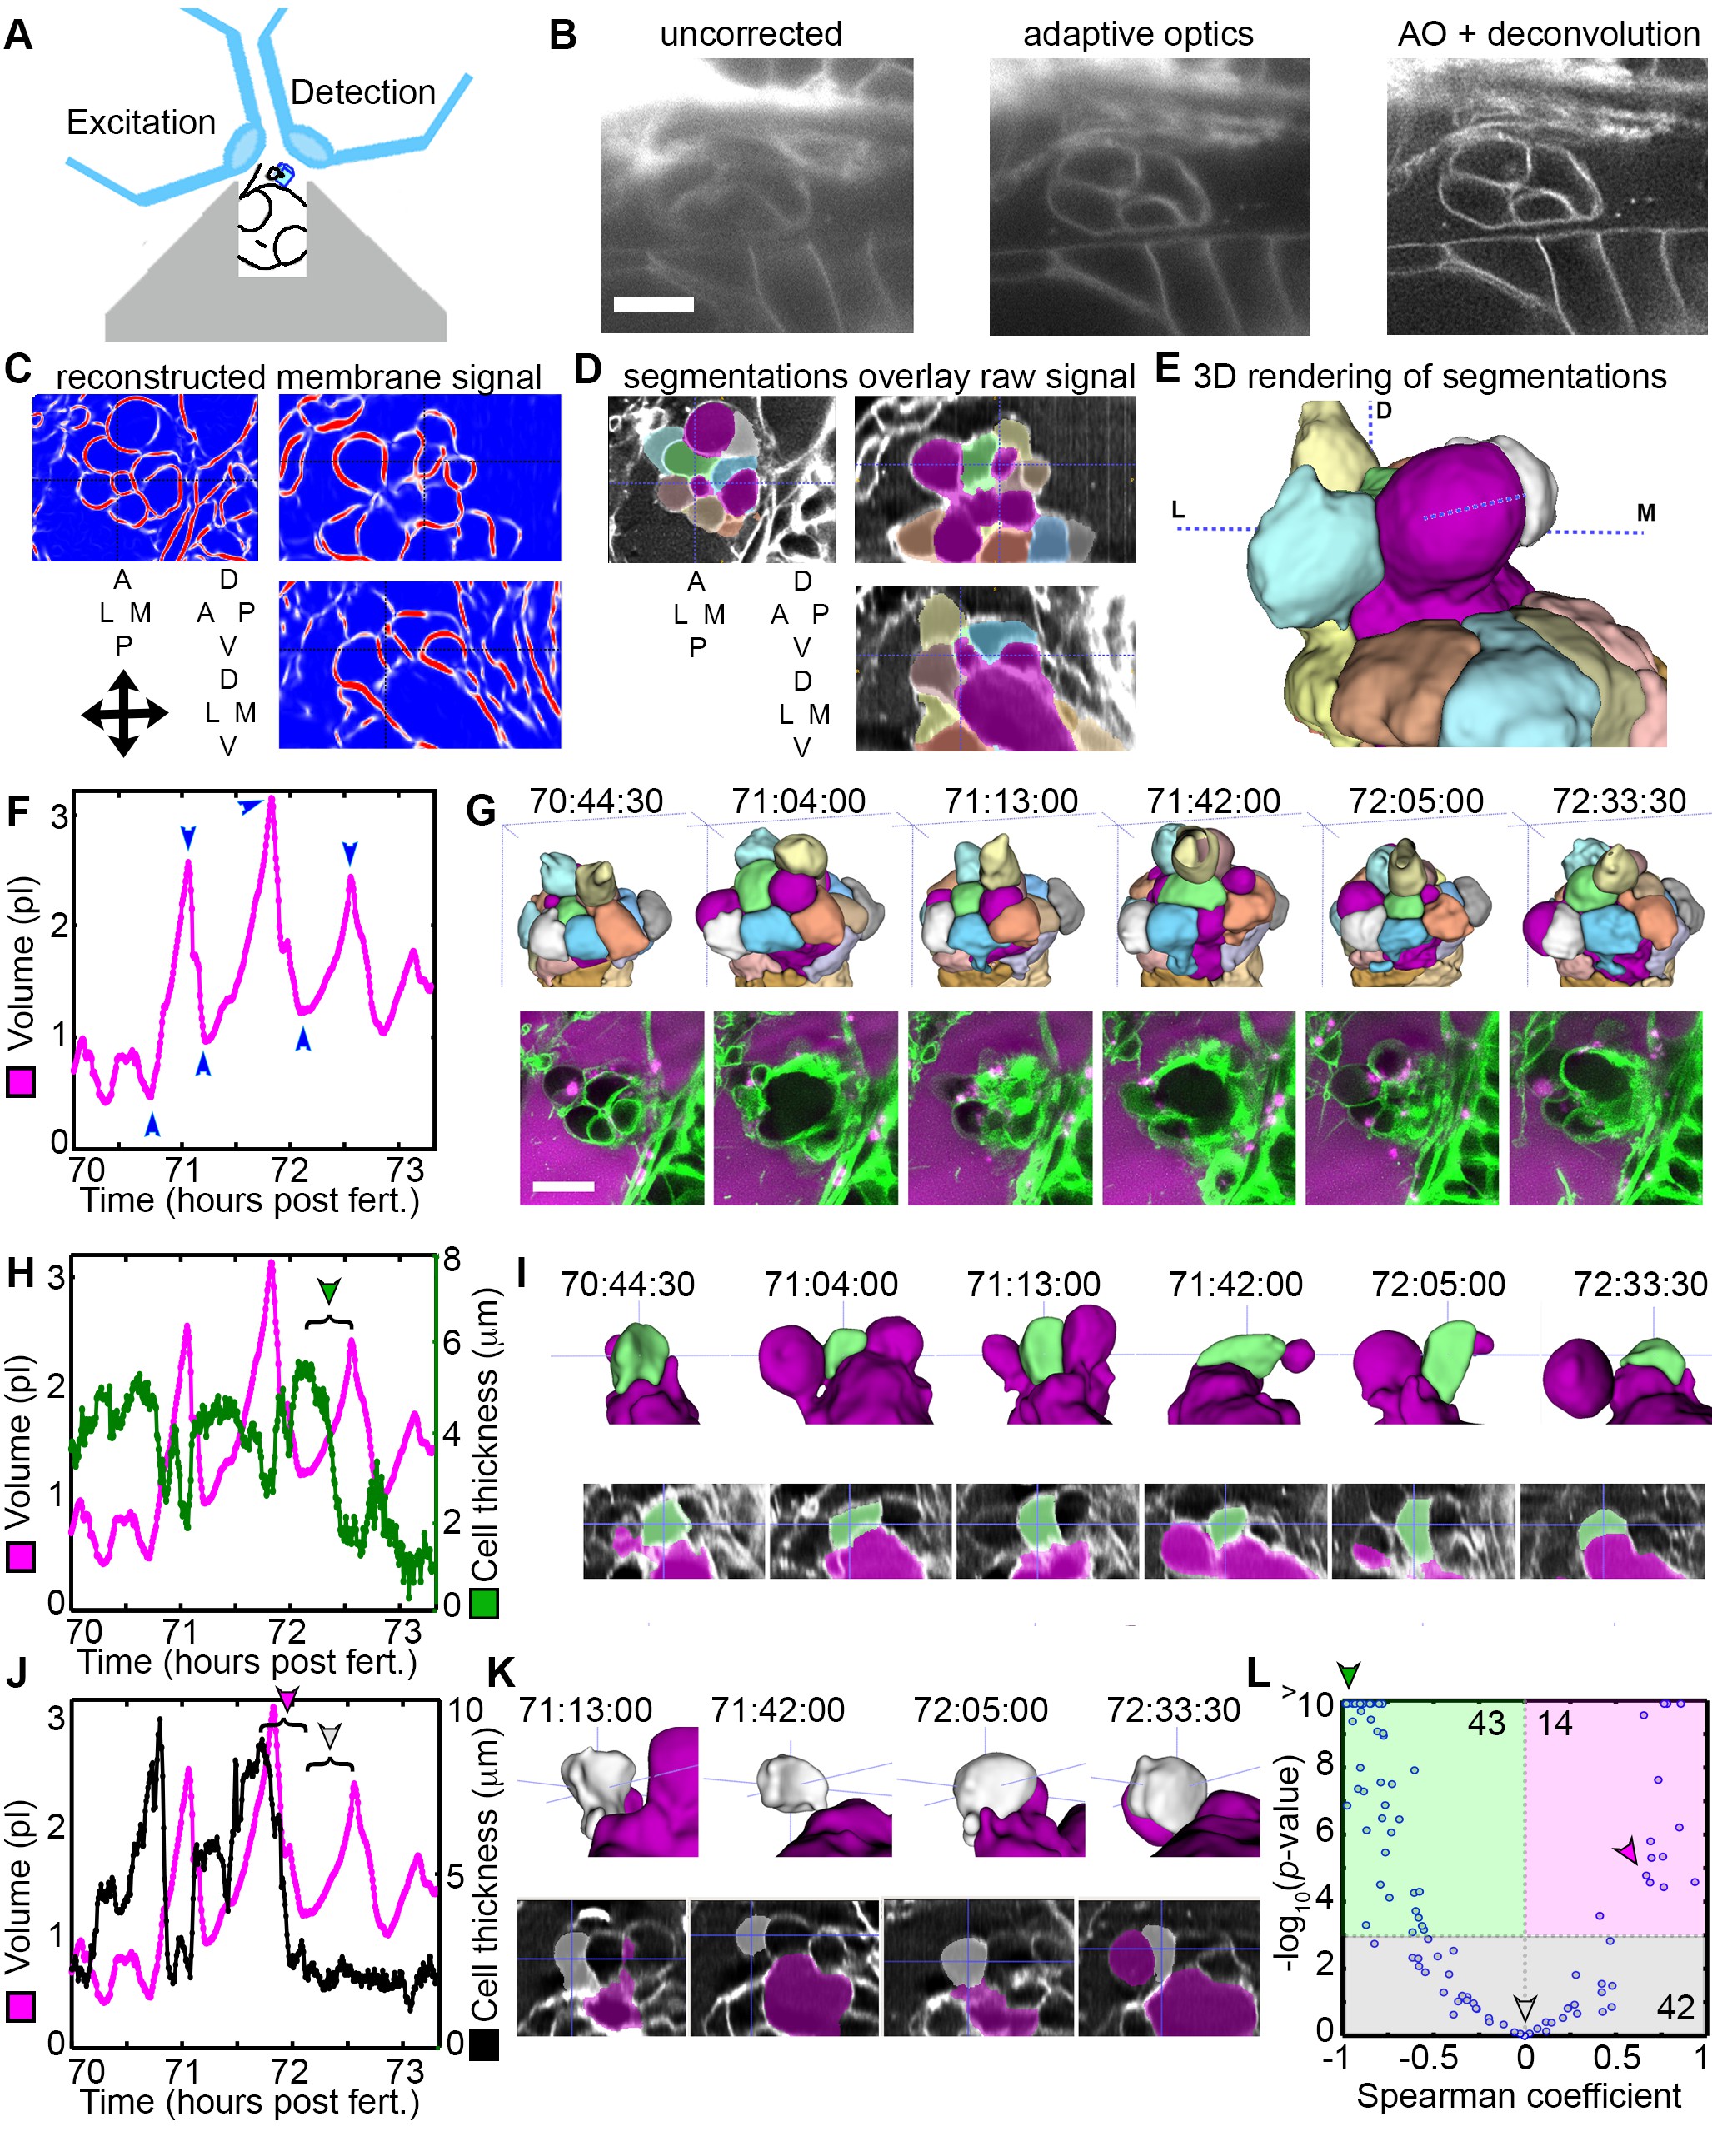
Fig. 5
AO-LLSM reveals dynamics of ES cells.
(A) Illustration of AO-LLSM mounting strategy for imaging ES using volcano mount. (B) Representative LLSM images without adaptive optics (AO), with AO, and with AO followed by deconvolution. (C) Three orthogonal views of ACME membrane reconstruction. (D) Three orthogonal views of raw fluorescence signal overlaid with cell segmentations and ES lumen segmentation (magenta), n = 4. (E) 3D rendering of segmented cells and ES lumen (magenta). (F) Volume measurements of segmented ES lumen, imaged every 30 s for over 3 hr (Videos 8–10). Blue arrowheads point to time points presented in G and I. (G) Top, dorsal perspective displaying 3D renderings of segmented cells. Bottom, maximum intensity projections (MIP) of 4.5 μm slab through tip of ES shows raw data of the ES for the same time points. (H) Secondary axis presents green cell’s thickness versus time (green cell in (G)). Again, primary axis is volume of ES lumen for comparison. (I) Top, 3D renderings of just green cell from (G) and magenta lumen highlight stretching of cell, dorsal-medial perspective. Bottom, centered cross-sectional view of raw data overlaid with green cell’s and ES lumen’s segmentations for the same time points. (J) Secondary axis is plot of grey cell’s thickness (grey in (G)). (K) Top, 3D renderings of only grey cell and magenta lumen. Bottom, centered cross-section view of raw data overlaid with grey cell’s and ES lumen’s segmentations for same time points. (L) Scatter plot of results from Spearman correlation test of cell thickness trajectories and ES lumen volume trajectories for individual inflation and deflation intervals that are monotonic (example intervals bracketed in H and J). Green region highlights significant correlation (p-value<10−3) between cells thinning during inflation or thickening during deflation. Green arrowhead points to test result for bracketed interval in H. Grey region highlights instances where there is no significant correlation between the trajectory of cell thickness and lumen volume. Grey arrowhead points to test result for bracketed interval in J (grey arrowhead). Magenta region highlights significant correlation between cells thinning during deflation or thickening during inflation. Magenta arrowhead points to test result for bracketed interval in J (magenta arrowhead). Y-axis was capped at 10 so that all values greater than or equal to 10 plot as 10, n = 99. All scale bars 10 μm.