
|
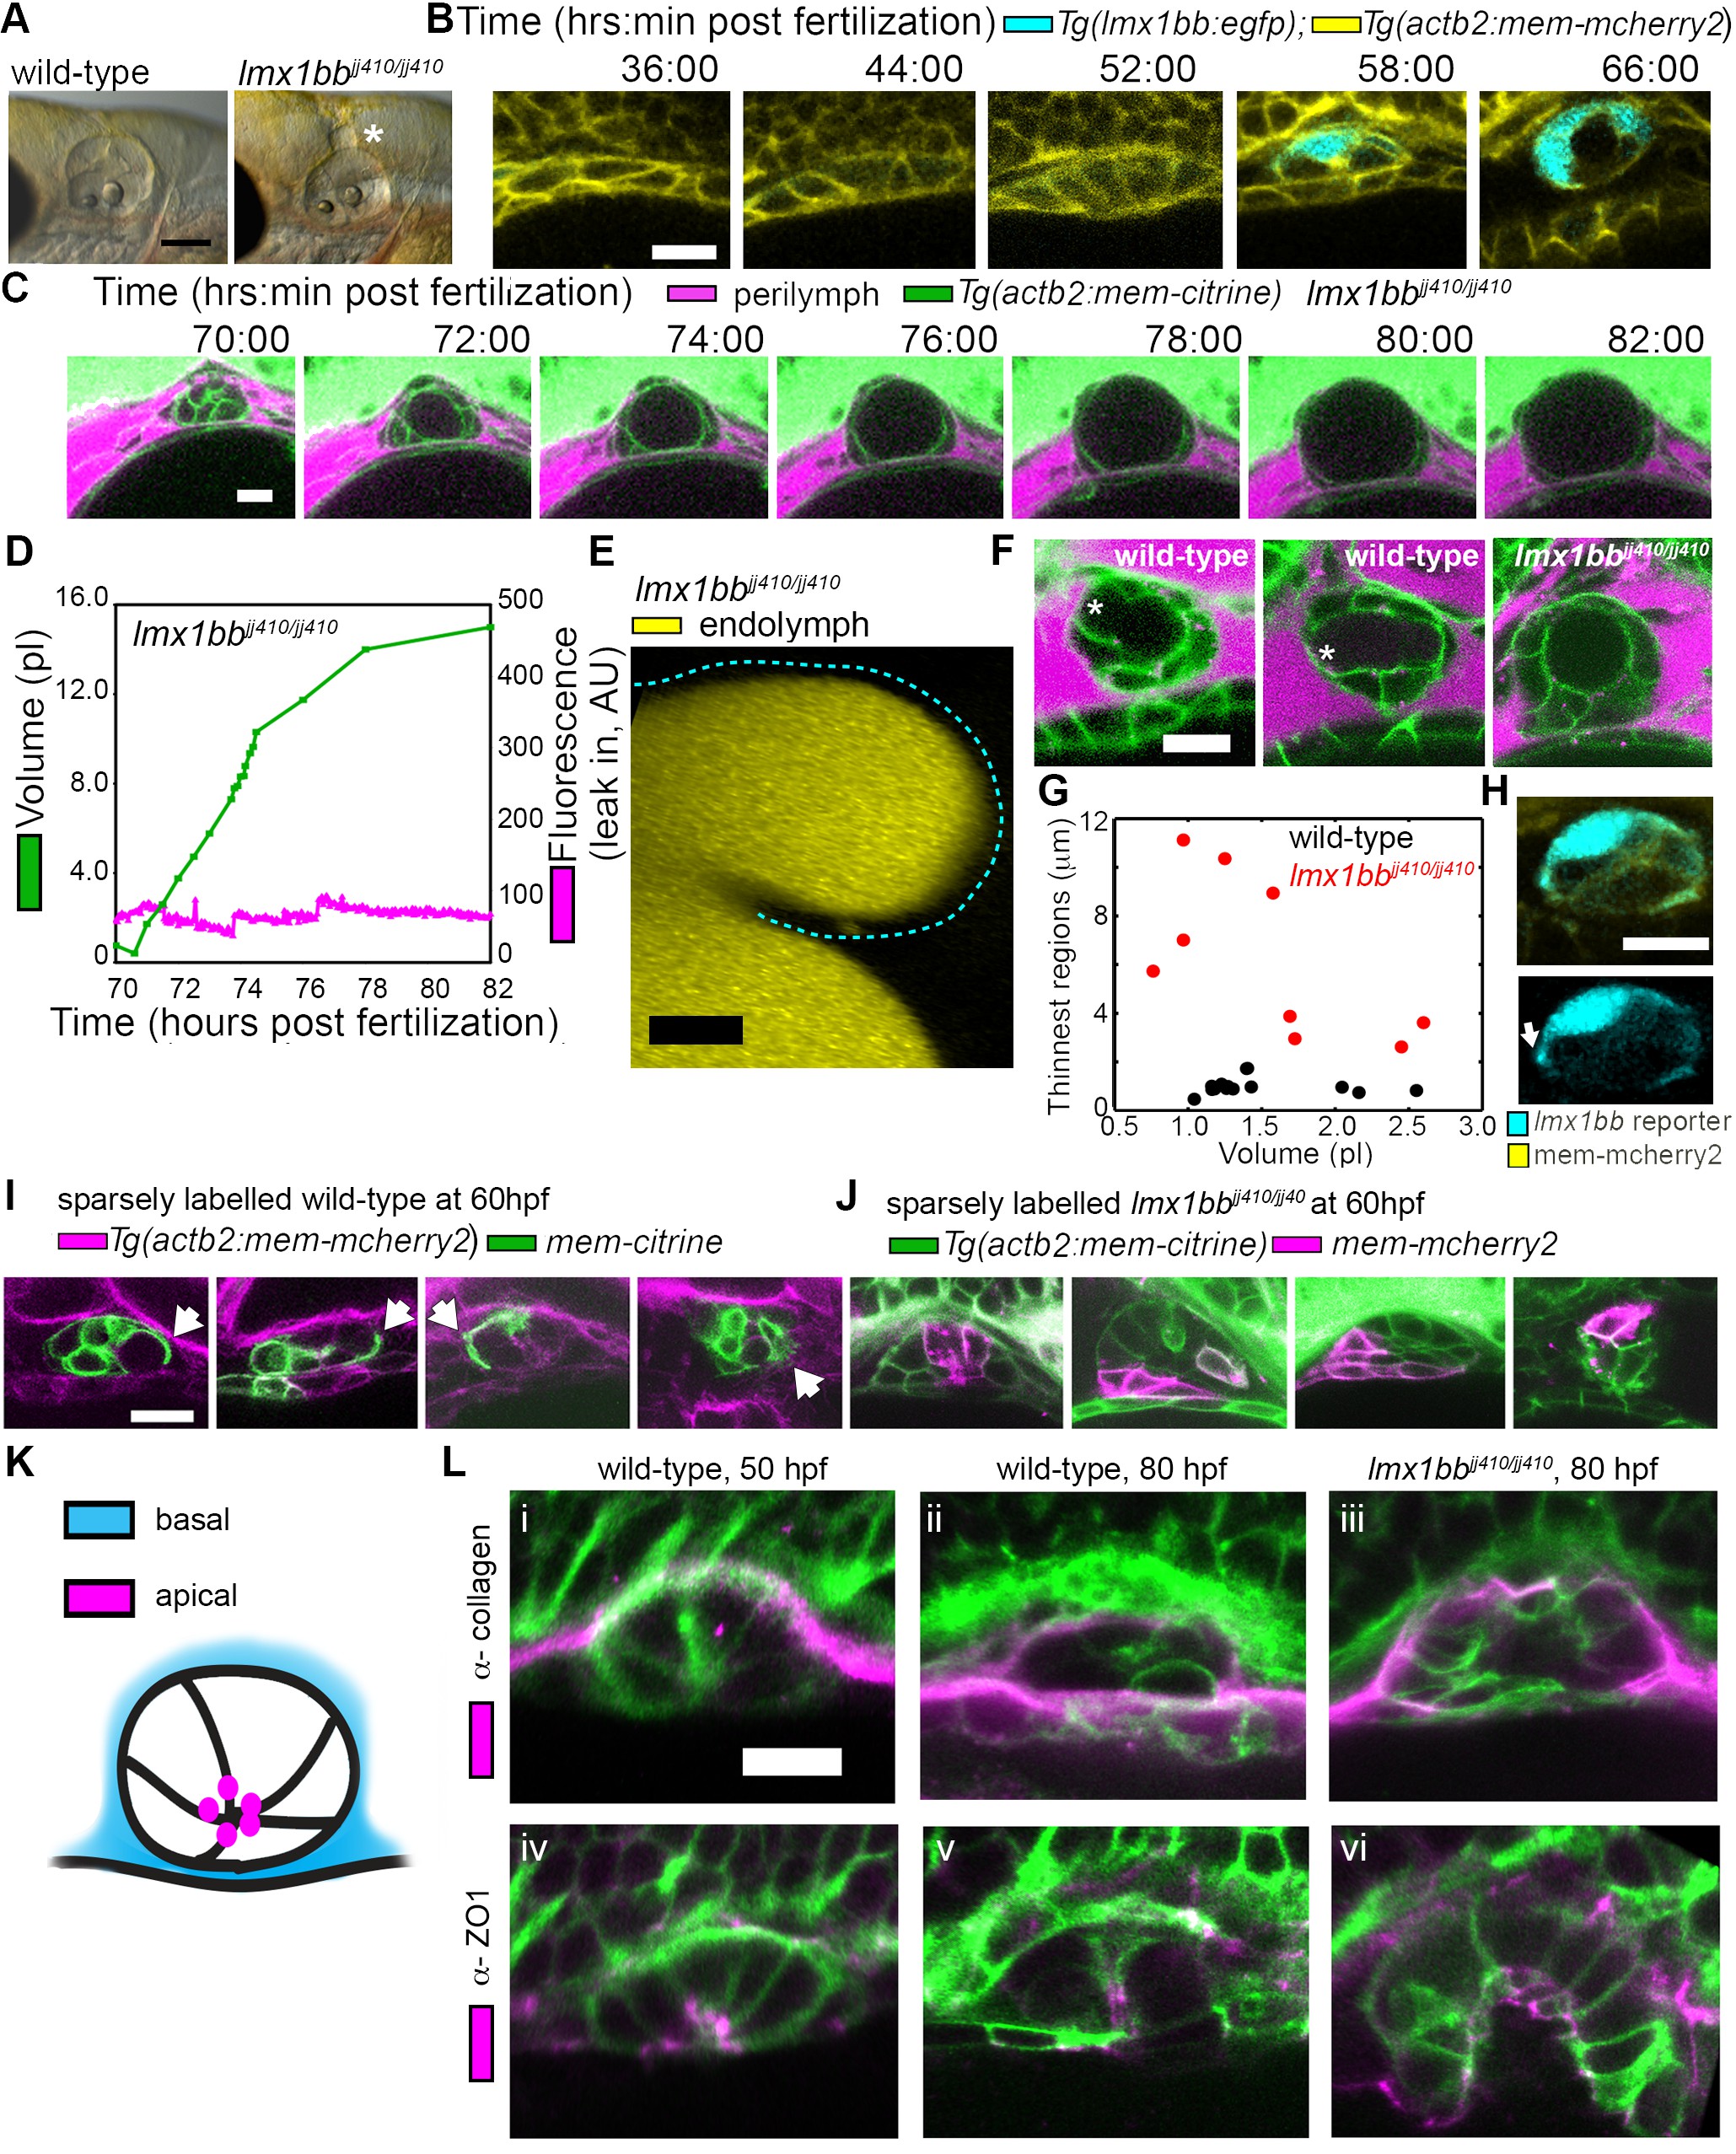
Fig. 3
Lmx1bb is necessary for development of the ES’s ability to form breaks in its diffusion barrier and deflate.
(A) Lateral view of wild-type and lmx1bbjj410/jj410 mutant ears imaged by bright-field microscopy at 80 hpf, asterisk labels greatly enlarged mutant ES. Scale bar, 100 μm. (B) Slices from 3D confocal time course of an lmx1bb transcriptional reporter (cyan, Tg(lmx1bb:egfp)mw10/mw10; yellow, Tg(actb2:mem-mcherry2)hm29), n = 3. (C) Slices and select time points from 3D confocal time course of lmx1bbjj410/jj410 mutant embryos. Membrane (green) from ubiquitous membrane citrine transgenes. Perilymph (magenta) from 3 kDa dextran-Texas red, n = 4. (D) Quantification of segmented ES volumes (primary axis, green) and leak-in fluorescence (secondary axis, magenta) from lmx1bbjj410/jj410 time course in (C) (see also Figure 3—figure supplement 1 and Videos 5–6). (E) 3D transverse view (endolymph in yellow) from timelapse showing endolymph in dilated mutant ES, outlined with dashed blue line, n = 2. (F) Small regions with thin membranes (asterisks) form in the inflated ES of wild-type but not lmx1bb mutants. (G) Quantification of minimum epithelial thickness versus inflated ES volume in mutant (plotted in red, n = 9) and wild-type (plotted in black, n = 14). Compiled from 65 to 80 hpf embryos. (H) Uneven labeling from Tg(lmx1bb:egfp) reveals thin basal processes (white arrow). (I) Wild-type ES examples with sparsely labeled cells: membrane-labeled citrine (green) in a membrane-labeled cherry background (magenta), white arrows indicate lamellar projections, n = 15. (J) lmx1bbjj410/jj410 mutant ES examples with sparsely labeled cells: membrane cherry (magenta) in a membrane citrine background (green), n = 9. (K) Cartoon schematic of apico-basal organization of ES. (L) Supporting whole-mount immuno-stains for basal and apical markers (collagen and ZO-1, both magenta) in a membrane-labeled citrine background (green), n = 16, 15, 6, 32, 21, and 12 for (i-vi). Scale bars in (B-L), 10 μm.