
|
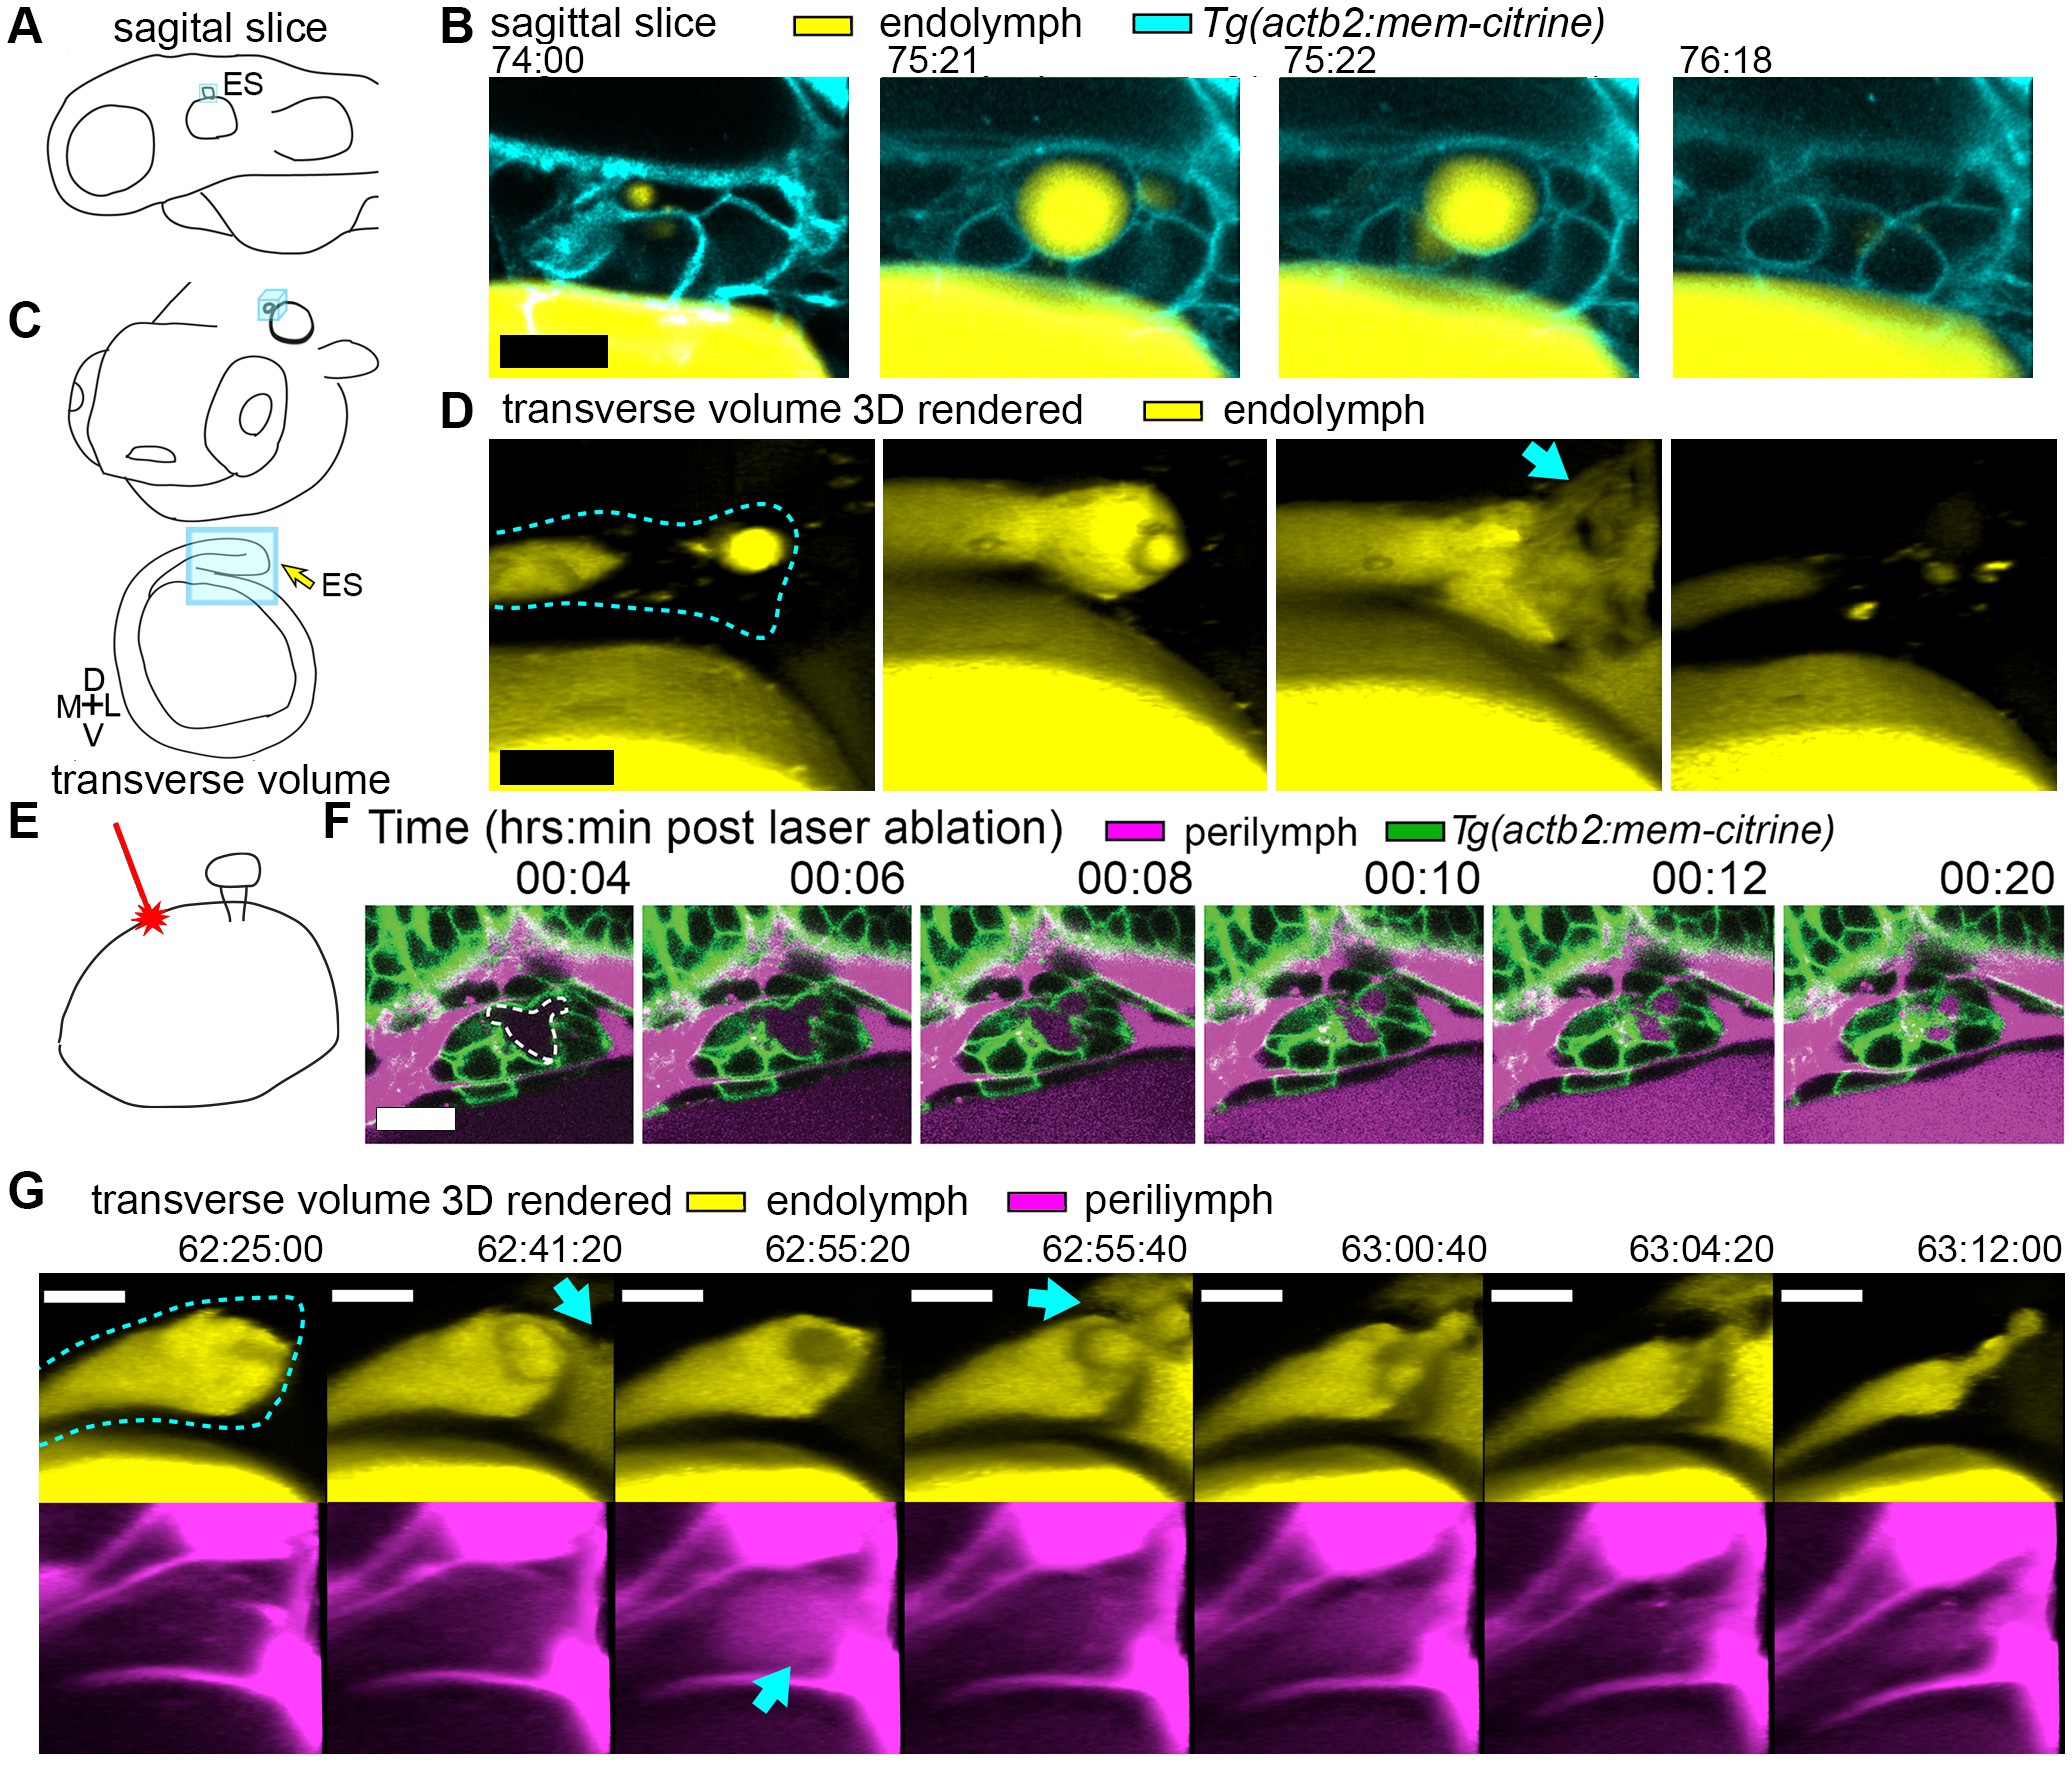
Fig. 2
Hydrostatic pressure transmits endolymph through duct to inflate the ES.
(A) Illustration of larval zebrafish highlighting sagittal plane of image acquisition (blue square). (B) Time points of individual sagittal slices of raw data from 3D time course (endolymph labeled yellow by single dye injection into otic vesicle, membrane citrine in cyan). (C) Illustration of larval zebrafish highlighting transverse perspective (blue box) for rendered volumes of ES. (D) Time points from time course of raw data rendered in 3D transverse view (endolymph in yellow, ES tissue outlined with dashed line) showing endolymph flowing through duct to ES and then out to perilymph (blue arrow). (E) Illustration of strategy for laser ablating otic vesicle cells with point-scanning 2-photon laser to ablate 2–3 targeted cells. (F) Slices from 4D confocal time course after laser ablation showing ES deflation. ES lumen is outlined with a white dashed line in (F), n = 4. (G) Time points from time course rendered in 3D transverse view (endolymph in yellow, perilymph in magenta, ES tissue outlined with dashed line), n = 8. Blue arrows indicate endolymph expulsion or perilymph leak in events (D,G). All scale bars 10 μm.