
|
Fig. 1-S1
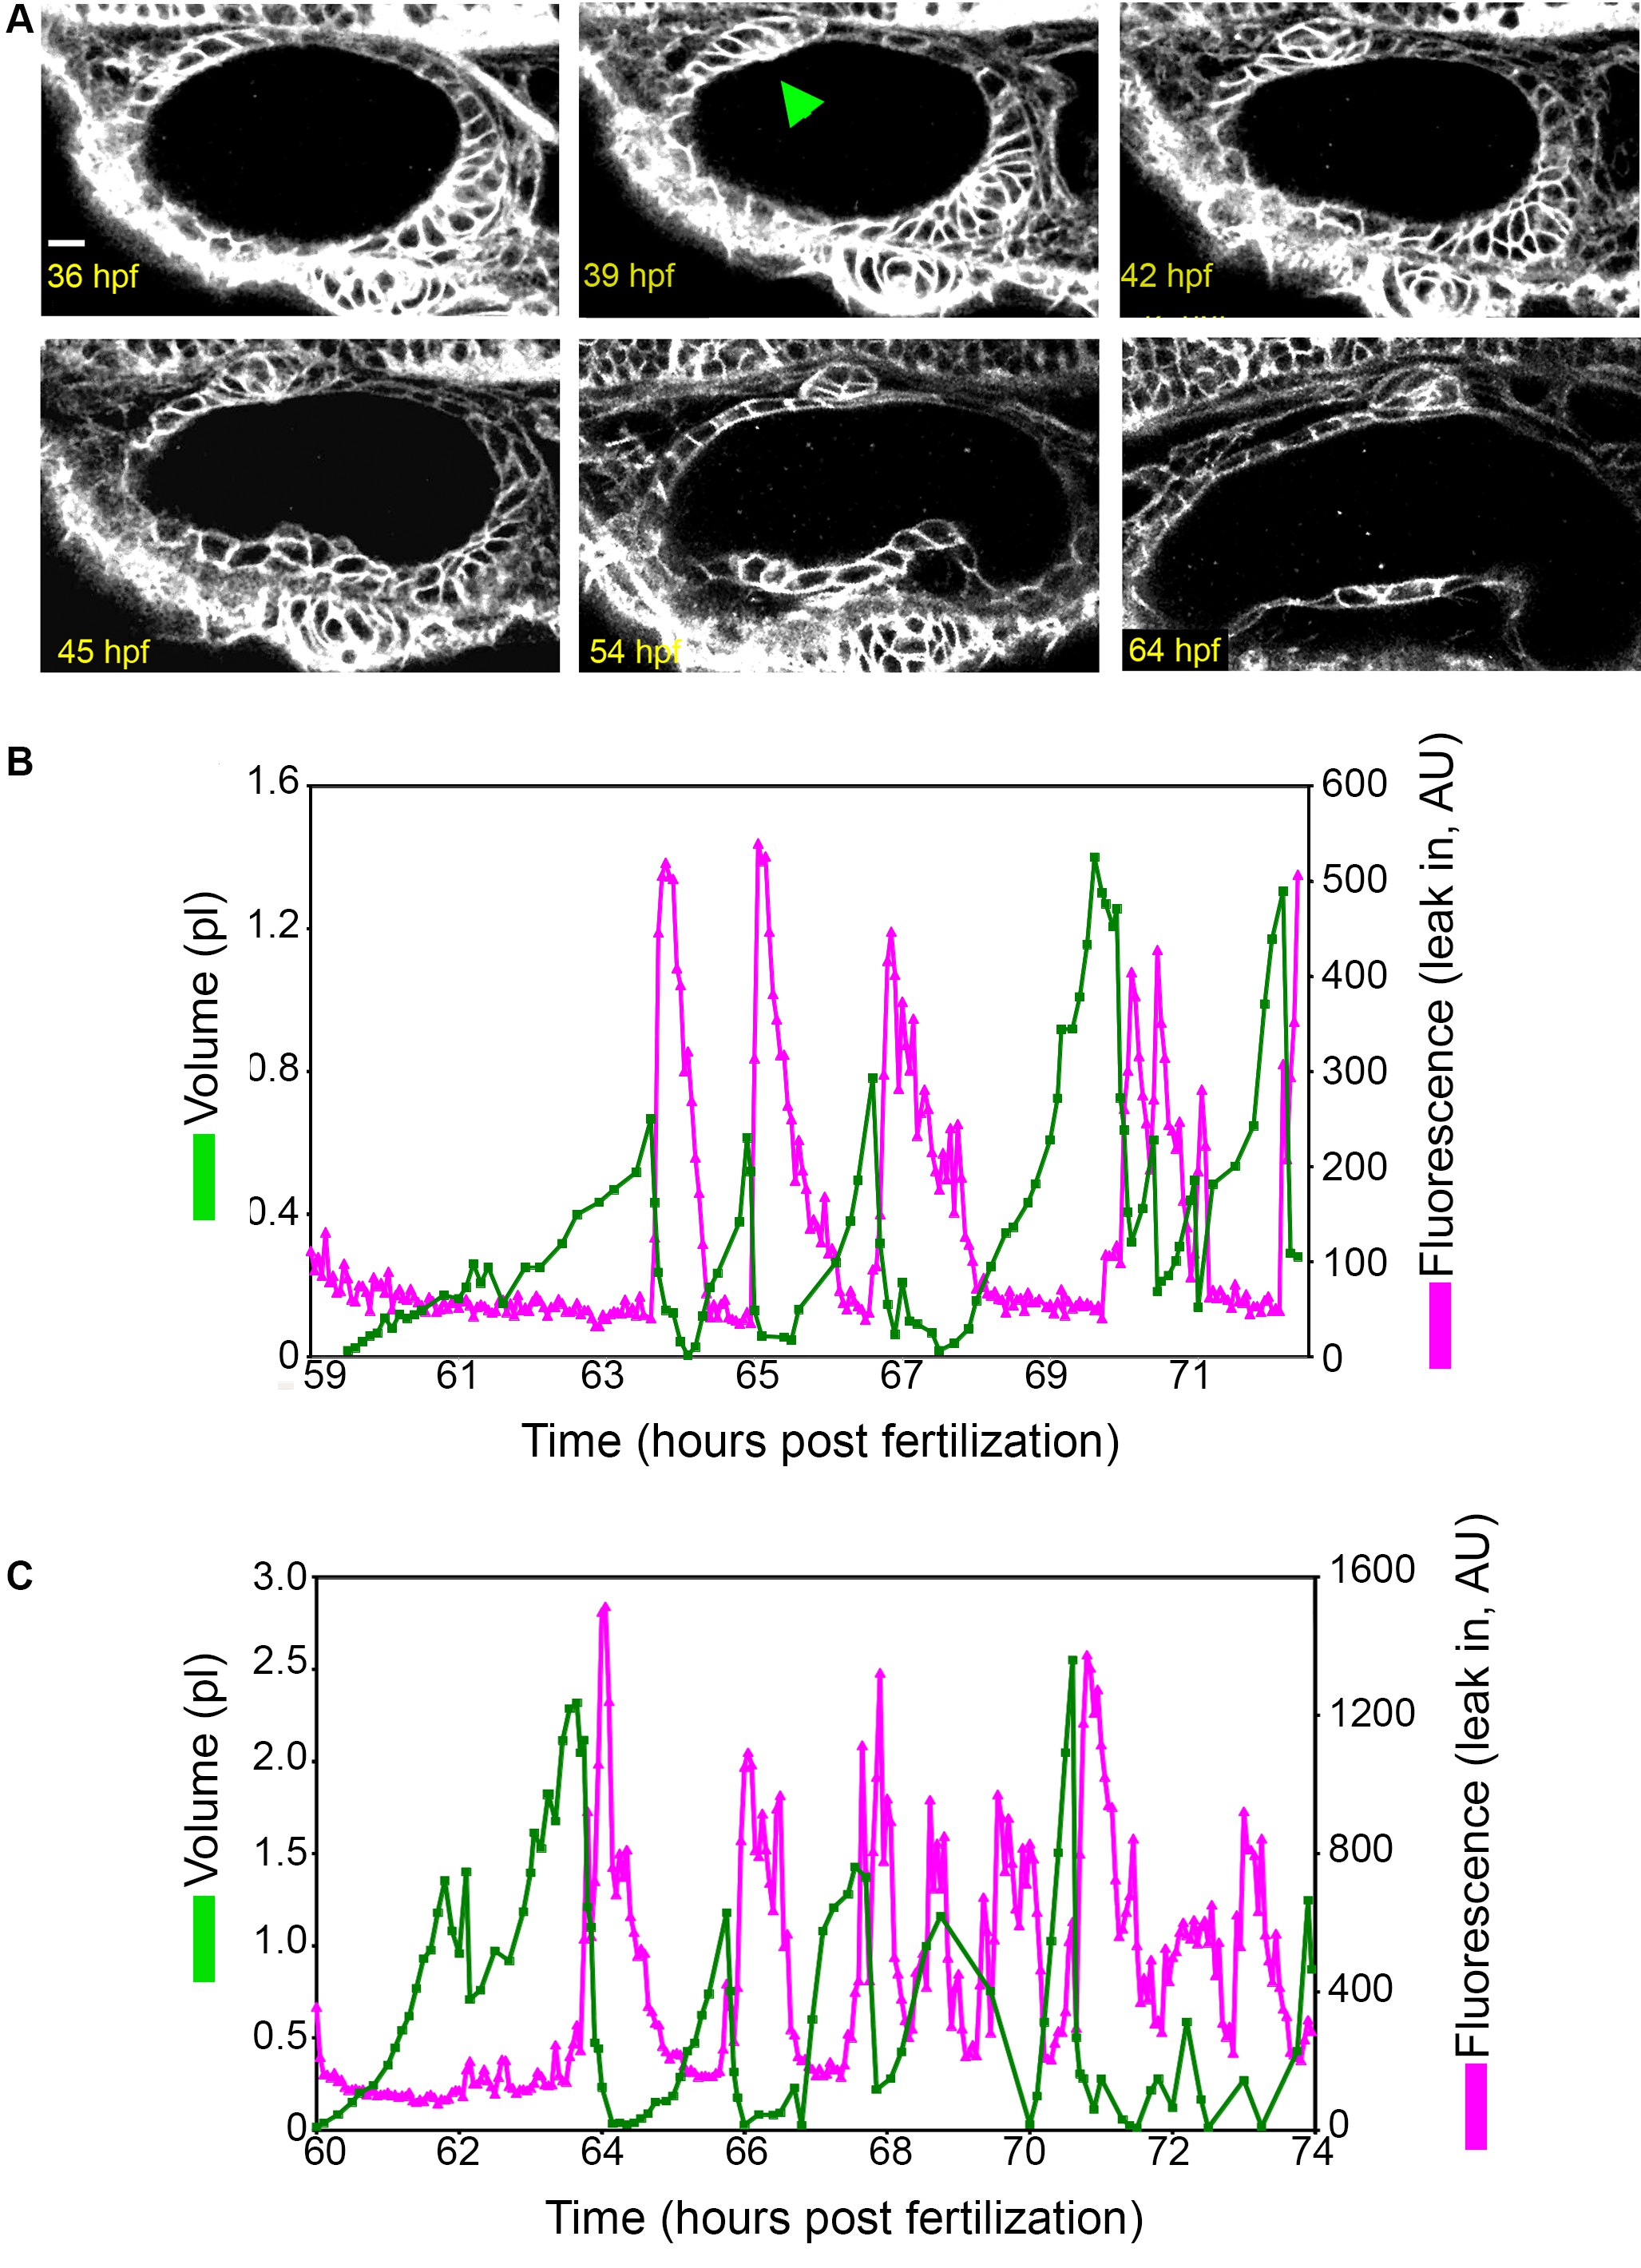
Early ES development and additional examples of wild-type ES inflation and deflation.
(A) ES morphogenesis begins at 36-hr post fertilization (hpf) as an evagination in the dorsal epithelial wall of the otic vesicle (green arrowhead points to nascent ES, see also Video 1). Scale bar 10 μm. (B–C) Quantification of segmented ES volumes (primary axis, green) and leak in fluorescence (secondary axis, magenta) over multiple cycles. (B) Quantification of segmented ES volumes (primary axis, green) and leak in fluorescence (secondary axis, magenta) over multiple cycles (see left panel of Video 3). (C) Additional time-lapse analysis (see right panel of Video 3).