
|
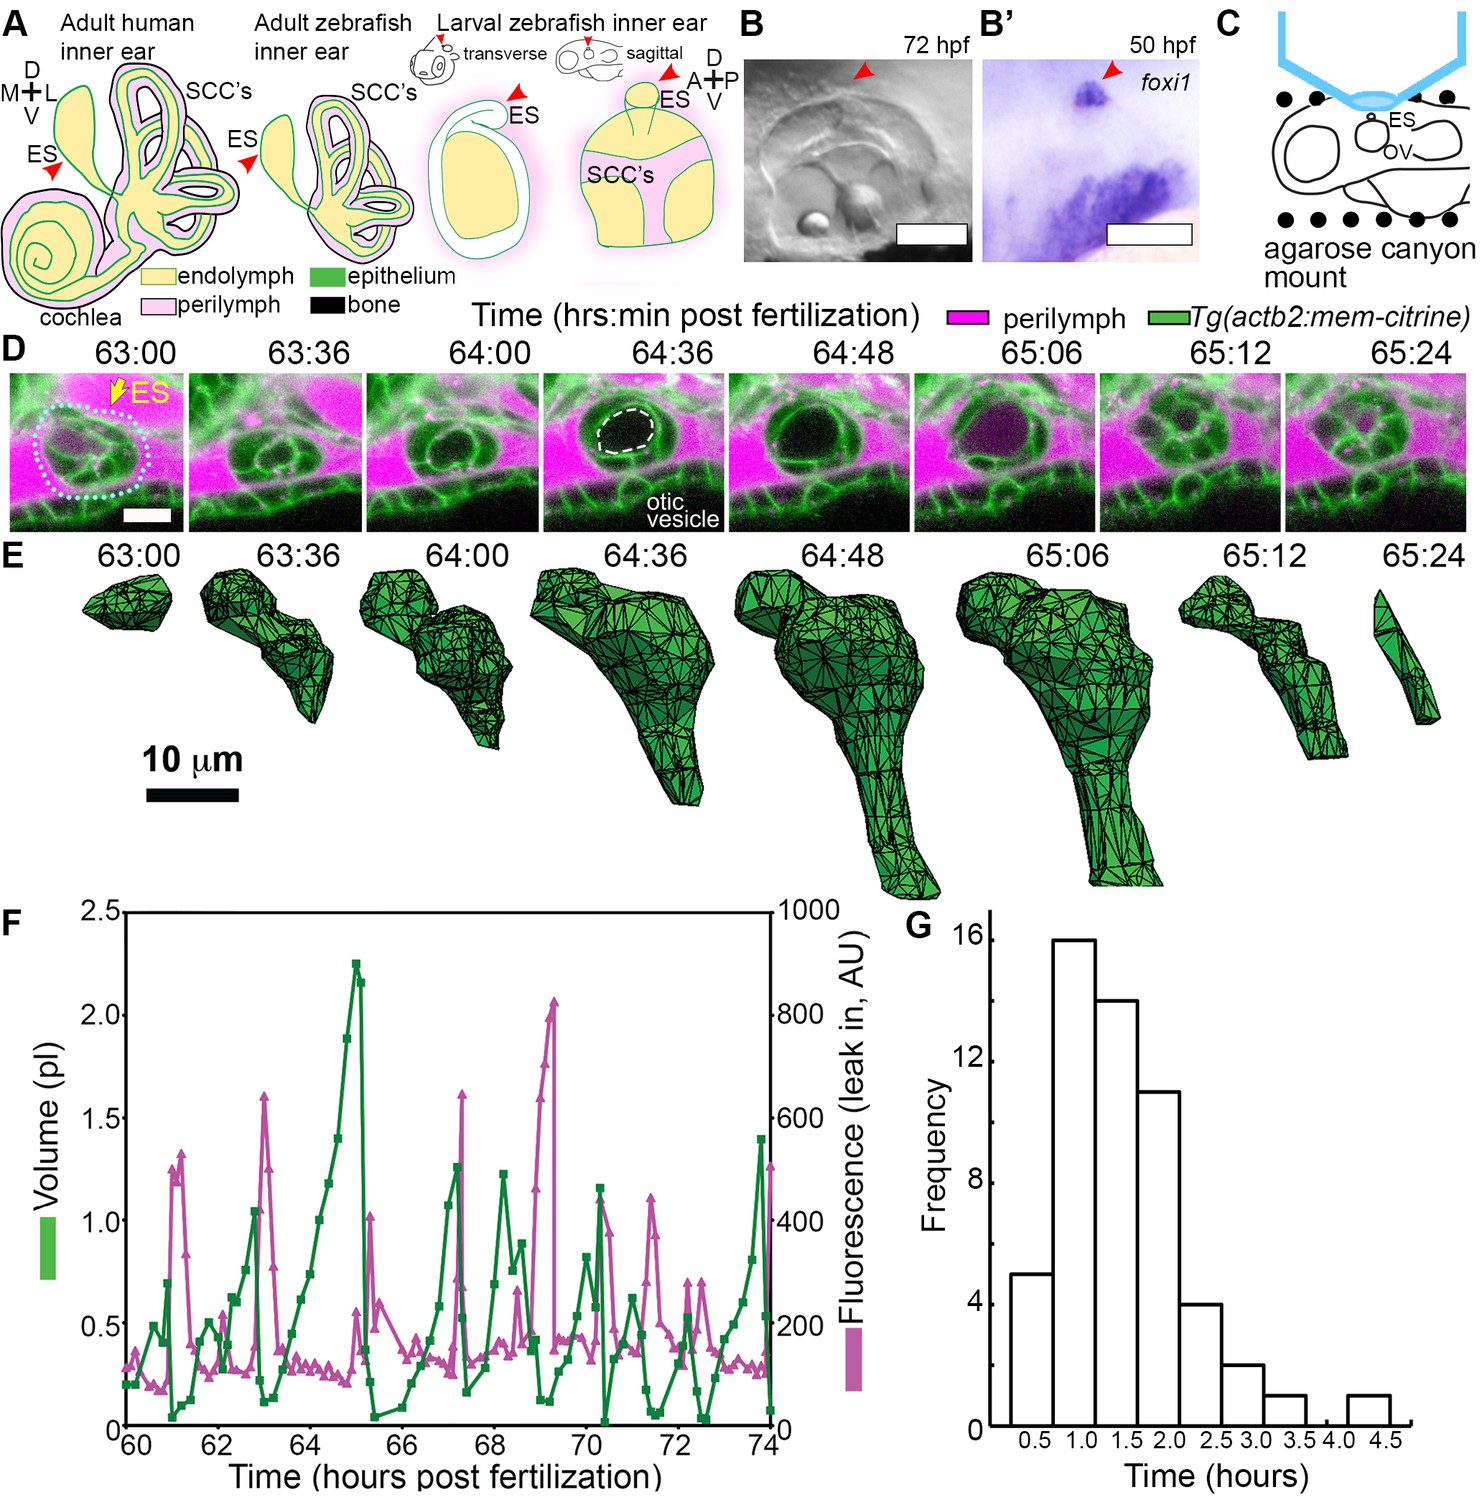
Fig. 1
ES lumen slowly inflates and rapidly deflates every 0.3–4.5 hr.
(A) Illustration of the adult human inner ear showing cochlea, semicircular canals (SCCs), and endolymphatic duct and sac (ES, red arrowhead) and their organization of tissue (green), endolymph (beige), perilymph (magenta), and bone (black). Illustrations of the adult and larval zebrafish inner ear showing ES (indicated with red arrowheads, see also Figure 1—figure supplement 1 and Video 1 for how the zebrafish ES first forms). (B) Micrograph of larval zebrafish, sagittal view. (B’) In situ of foxi1 highlights position of ES (red arrowhead), n = 12. (C) Illustration of imaging setup. (D) Slices and select time points from 3D confocal time course showing a single inflation and deflation event from a live zebrafish embryo. Cell membranes (green) are labeled using ubiquitous membrane citrine transgenes. Perilymph (magenta) is labeled with 3 kDa dextran-Texas red. ES identified with dotted blue outline and yellow arrow. Lumen of inflated ES identified with dashed white outline in 64:36 panel. (E) Corresponding 3D meshes of the segmented ES lumen volume. (F) Quantification of segmented ES volumes (primary axis, green) and leak in fluorescence (secondary axis, magenta) over multiple cycles (see also Figure 1—figure supplement 1B,C and Videos 2–3). (G) Histogram of times between peak inflation volumes, compiled from eight different time courses and 54 inflations. Scale bars 100 μm for (B) and 10 μm for (D,E).