
Image
|
Figure Caption
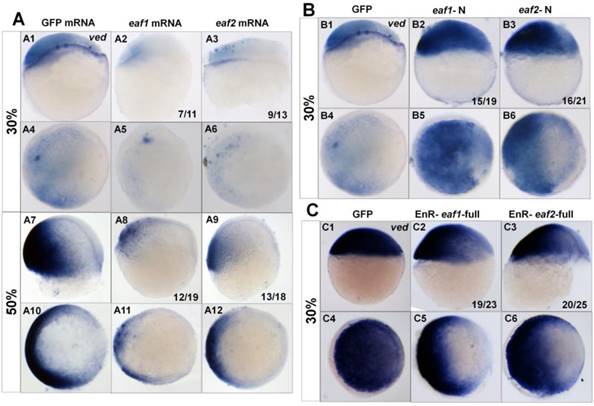
Fig. 3
Expression of ved in embryos with ectopic expressions of different forms of eaf1 or eaf2. (A1-A12) Expression of ved was obviously reduced in embryos with ectopic expression of eaf1 or eaf2 at 30% epiboly stage (A1-A6) and at 50% epiboly stage (A7-A12). (B1-B6) Ved expression was obviously increased in embryos injected with eaf1/2-N, dominant forms of eaf1/2. (C1-C6) Expression of ved was obviously reduced in embryos injected with EnR-eaf1/2-full. A1-A3, A7-A9, B1-B3, C1-C3, lateral view, dorsal to the right; A4-A6, A10-A12, B4-B6, C4-C6, animal view, dorsal to the right.
Acknowledgments
This image is the copyrighted work of the attributed author or publisher, and
ZFIN has permission only to display this image to its users.
Additional permissions should be obtained from the applicable author or publisher of the image.
Full text @ Int. J. Biol. Sci.