
|
Fig. 1
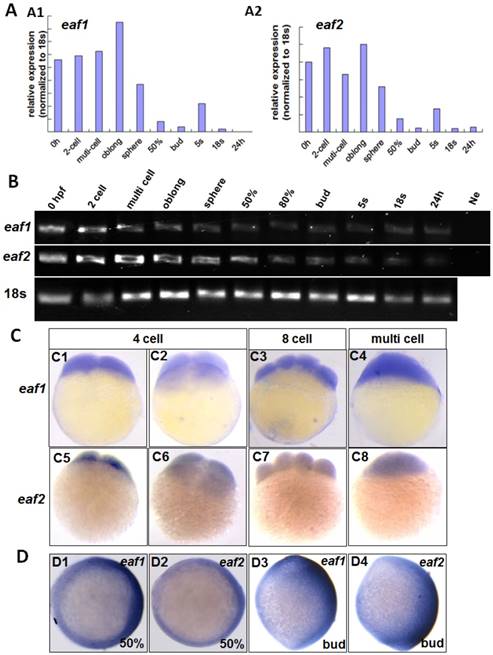
Maternal expression of eaf1 and eaf2 was detected by qRT-PCR (A), semi quantitative PCR (B), and whole mount in situ hybridization (C). (A, B) Embryos from 0 hpf, 2-cell stage (2-cell), multi-cell stage, oblong stage, sphere stage, 50% epiboly stage (50%), 80% epiboly stage (80%), bud stage, 5 somite stage (5s), 18 somite stage (18s), and from 24 hours post fertilization (24 h) were used for qRT-PCR (A) and semi quantitative PCR (B). Ne: negative control. (C) Maternal and uniform distributions of eaf1 and eaf2 in embryos at 4 cell stage, 8-cell stage and multi-cell stage were revealed by WISH. (D) Spatial distribution of eaf1 or eaf2 in embryos at gastrula stage (D1, D2) and at bud stage (D3, D4), and more eaf1 or eaf2 was distributed in the dorsal region of embryos. C1, C3, C4, C5, C7, C8, D3, D4, lateral view, anterior to the up; C2, C6, D1, D2, animal view, dorsal to the right for D1 and D2.