
|
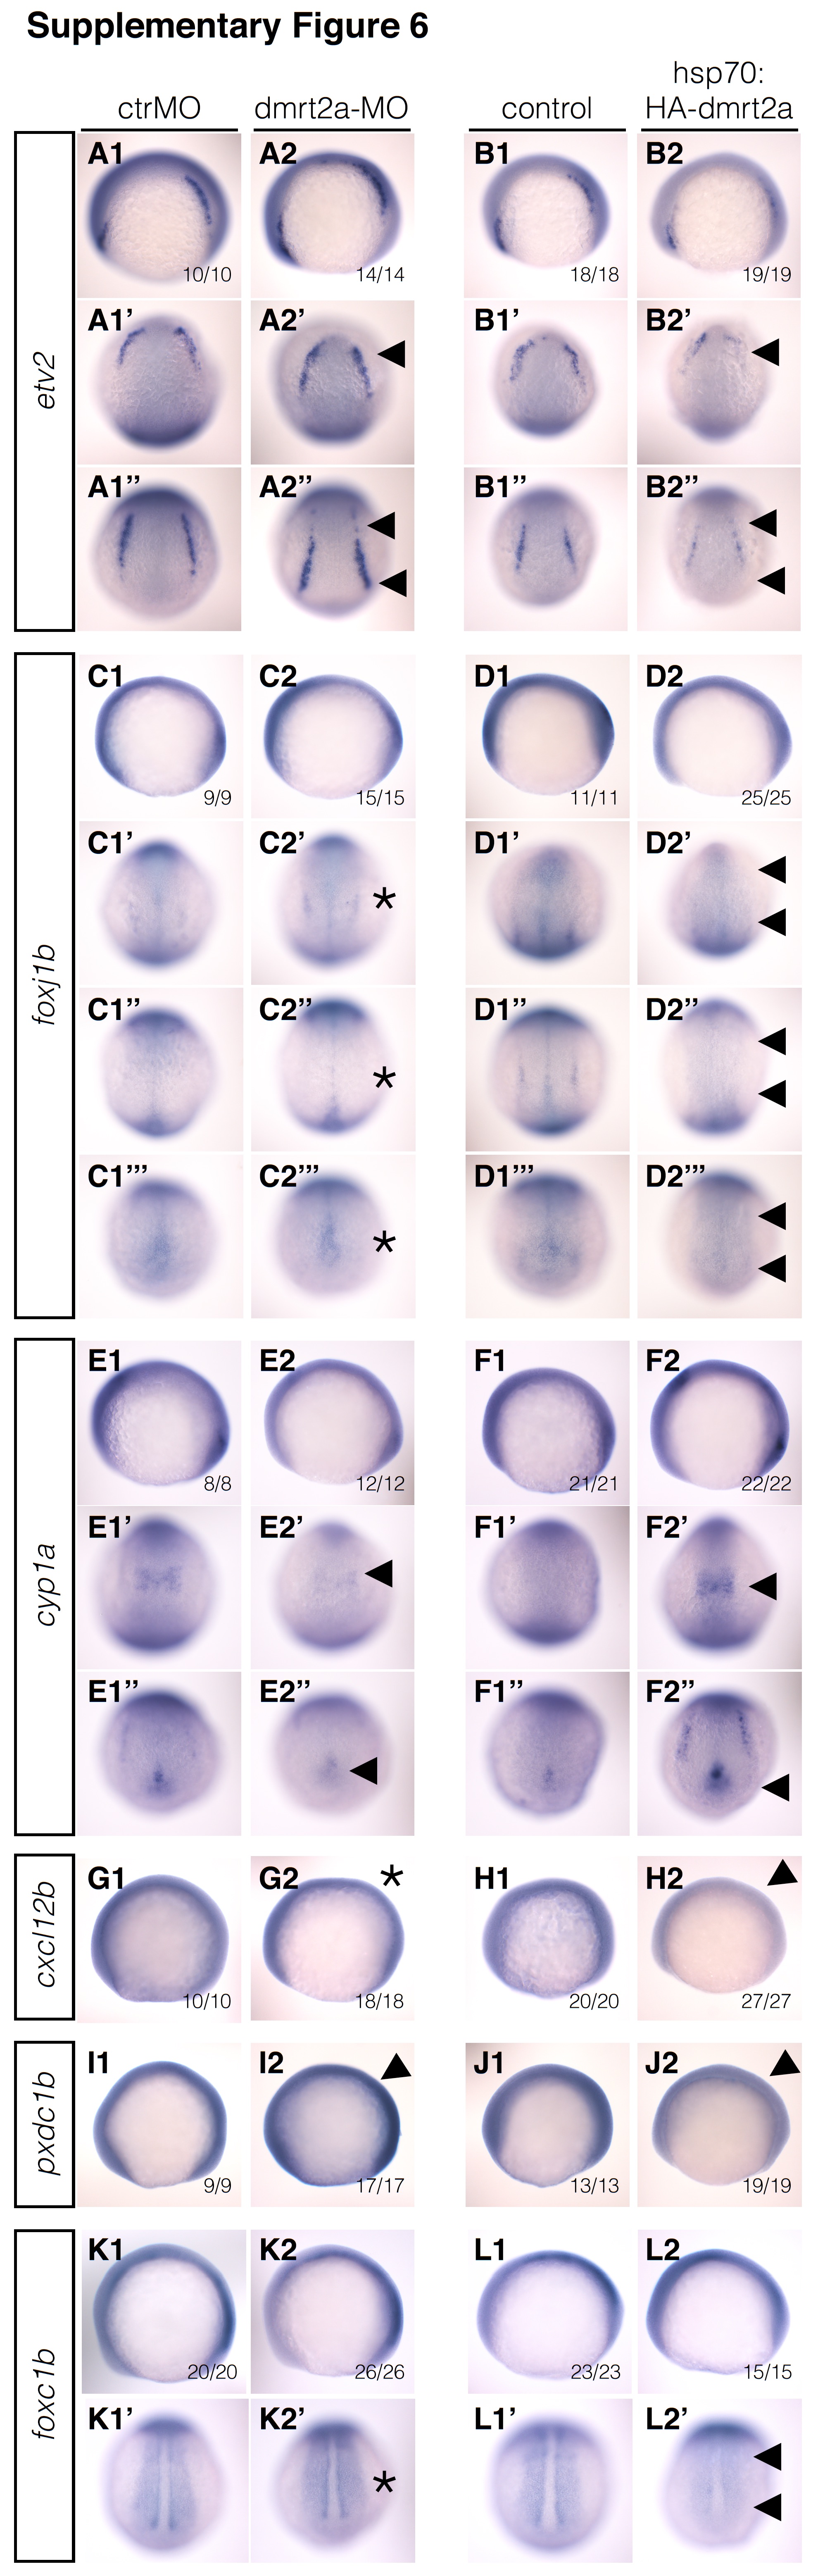
Fig. S6 No misexpression was found in the validated genes after dmrt2a gain and loss-of-function experiments. A1-L2’ In situ hybridisation results depicting the six genes validated in this work. A1-B2” etv2 expression pattern after injecting ctrMO (A1-A1”), dmrt2a-MO (A2-A2”), and after heat-shock in control (B1-B1”) and Tg(hsp70:HA-dmrt2a) (B2-B2”). C1-D2”’ foxj1b expression pattern after injecting ctrMO (C1-C1”’), dmrt2a-MO (C2-C2”’), and after heat-shock in control (D1-D1”’) and Tg(hsp70:HA-dmrt2a) (D2-D2”’). E1-F2” cyp1a expression pattern after injecting ctrMO (E1-E1”), dmrt2a-MO (E2-E2”), and after heat-shock in control (F1-F1”) and Tg(hsp70:HA-dmrt2a) (F2-F2”). G1-H2 cxcl12b expression pattern after injecting ctrMO (G1), dmrt2a-MO (G2), and after heat-shock in control (H1) and Tg(hsp70:HA-dmrt2a) (H2). I1-J2 pxdc1b expression pattern after injecting ctrMO (I1), dmrt2a-MO (I2), and after heat-shock in control (J1) and Tg(hsp70:HA-dmrt2a) (J2). K1-L2’ foxc1b expression pattern after injecting ctrMO (K1, K1’), dmrt2a-MO (K2, K2’), and after heat-shock in control (L1, L1’) and Tg(hsp70:HA-dmrt2a) (L2, L2’). After dmrt2a overexpression using Tg(hsp70:HA-dmrt2a) we did not observe misexpression of the six validated genes. Upon comparison with dmrt2a-MO injected embryos, we observed changes in the expression levels of some genes (arrowheads), according to qPCR data. As depicted with asterisks, after dmrt2a-MO injection we observed only very subtle changes in the expression pattern of some genes, corresponding to the less affected genes, as quantified by qPCR. All embryos were collected between 3 and 4-somite stage (loss-of-function experiments) and between 2 h and 2 h 30 min after heat-shock (gain-of-function experiments). (A1-B2, C1-D2, E1-F2, G1-H2, I1-J2, K1-L2) Lateral view, anterior to the left. (A1’-B2’, C1’-D2’, E1’-F2’) Dorsal-anterior view, anterior to the top. (A1”-B2”, C1”’-D2”’, E1”-F2”, K1’-L2’) Dorsal-posterior view, anterior to the top. (C1”-D2”) Dorsal-medial view, anterior to the top. ctrMO: control morpholino. (TIF 13209 kb)