
|
Fig. 2-S1
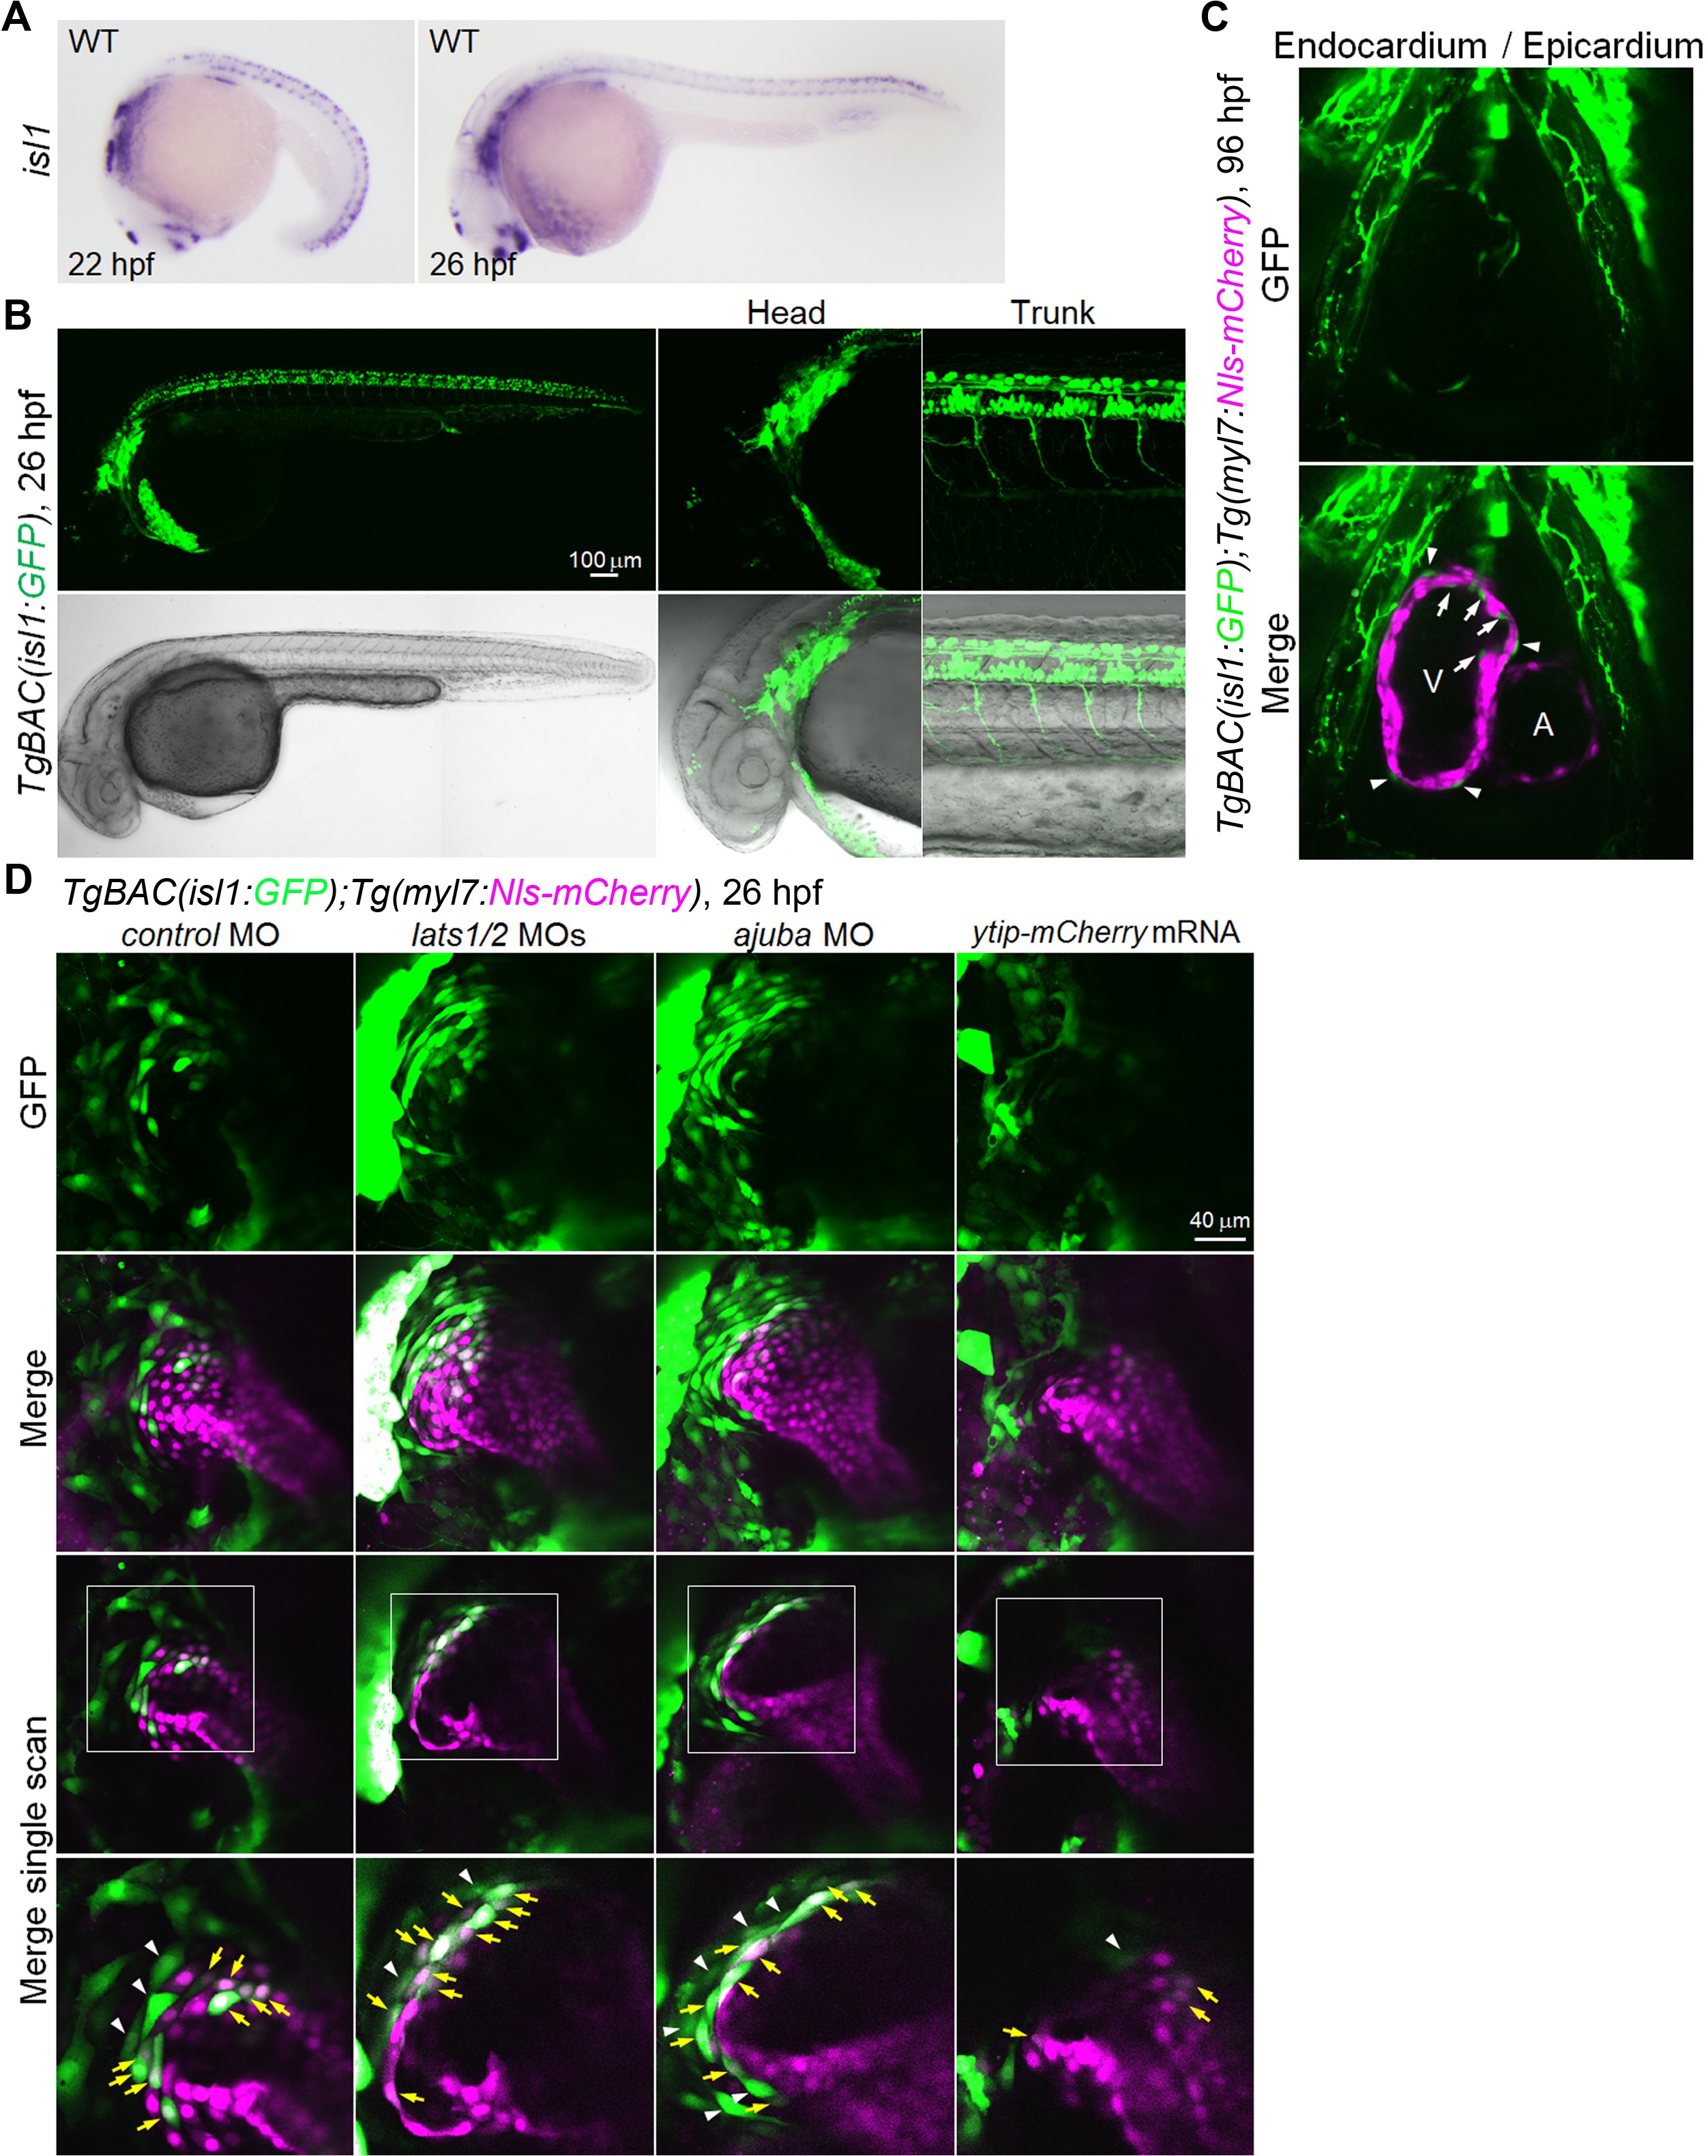
GFP expression in isl1 BAC transgenic fish recapitulates endogenous isl1 expression.
(A) WISH analyses of the WT embryos at 22 hpf (left, n = 12) and 26 hpf (right, n = 14) using an antisense probe for isl1. (B) Confocal 3D-stack images (at 26 hpf) of the TgBAC(isl1:GFP) embryos (n = 7). The expression pattern of isl1 reporter GFP in the dorsal diencephalon, telencephalon, pharyngeal arch, and neural tube recapitulates endogenous isl1 mRNA expression. (C) Single-scan confocal images (at 96 hpf) of the TgBAC(isl1:GFP);Tg(myl7:Nls-mCherry) embryos (n = 10). GFP-positive mCherry-negative cells in the inside (arrows) and outside (arrowheads) of myl7-promoter-active ventricular CMs are endocardial cells and epicardial cells, respectively. A, atrium; V, ventricle. Ventral view, anterior to the top. (D) Confocal images (at 26 hpf) of TgBAC(isl1:GFP);Tg(myl7:Nls-mCherry) embryos injected with MO and mRNA. The boxed regions are enlarged in the bottom panels. Yellow arrows indicate both isl1- and myl7-promoter-active cells in the venous pole. White arrowheads indicate the isl1-promoter-active cells that are in contact with myl7-promoter-active cells. Confocal 3D-stack images (upper two panels) and single-scan images (bottom two panels). Dorsal view, anterior to the top. The confocal 3D-stack images and single-scan images are a set of representative images from at least three independent experiments.