
|
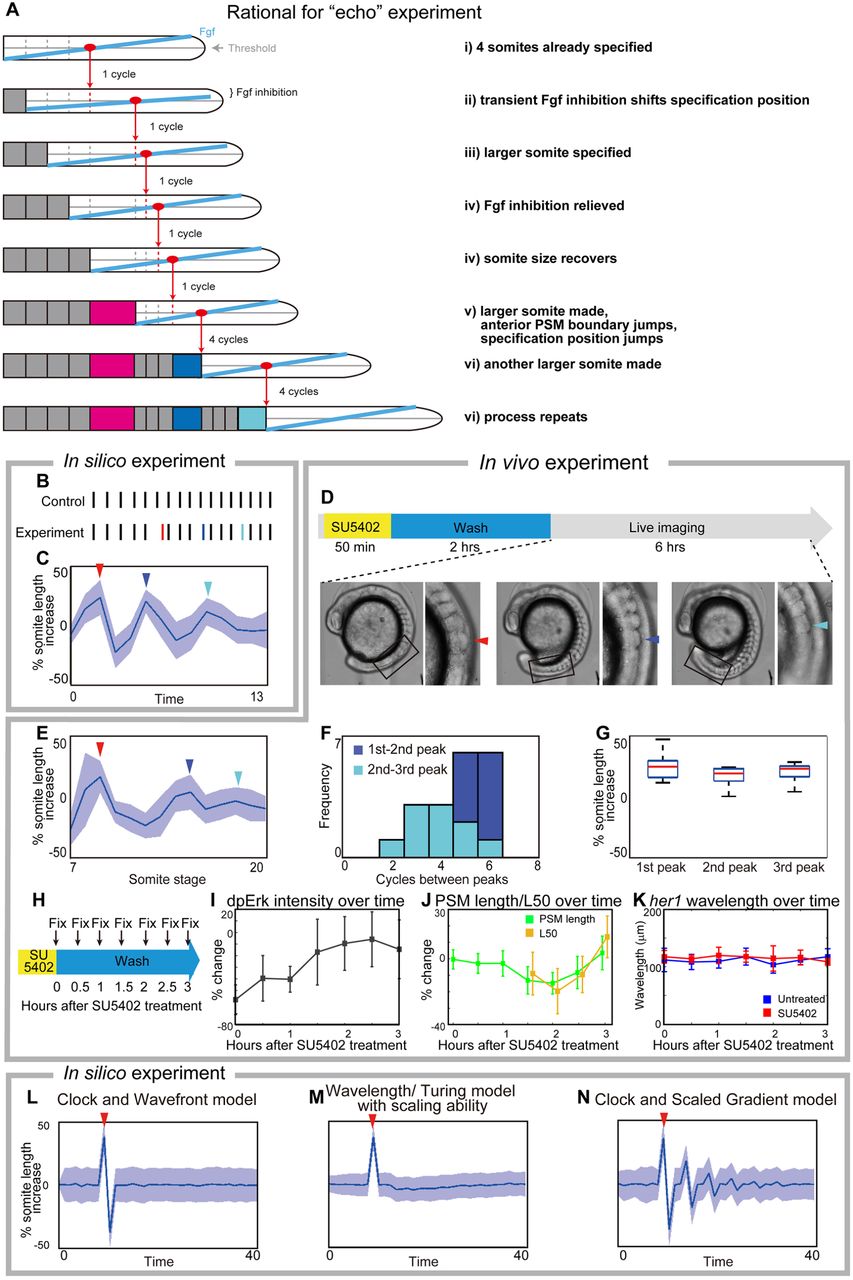
Fig. 6
Experimental validation of the clock and scaled gradient model. (A) Schematic of the outcome of the clock and scaled gradient model, following induction of one larger somite. The induced larger somite is magenta, and the larger somites as a result of system response are blue and cyan. (B,C) Simulation results without (B) and with (C) noise for somite size (red line in B, red arrowhead in C). Blue line in B and blue arrowhead in C show the second, and cyan line in B and cyan arrowhead in C show the third large somite. (D) Schematic of the in vivo experiment, and an embryo with larger somites at different time points. Boxed areas are shown at higher magnification to the right with arrowheads indicating the larger somite. (E) Time course of percentage increase in somite length of SU5402-treated embryos, compared with those in control embryos (n=12). (F) Frequency distribution of somite cycles between the peaks. (G) Percentage increase in somite size in SU5402-treated embryos at the peaks detected in each embryo, compared with control embryos at the corresponding somite stage. In both C and E, blue lines and blue shades indicate the average somite size and the variance of one standard deviation, respectively. For C-E, red, blue and cyan arrowheads show the first, second and third larger somites, respectively. (H-K) Examination of Erk activity (n=6 for each time point) and her1 wavelength (n=4-8 for each time point) after transient SU5402 treatment. Error bars denote s.d. (H) Schematic of the experiment. After fixation, the samples were subjected to dpErk immunostaining and her1 in situ hybridization. (I) Time course of percentage change in dpErk maximum intensity in SU5402-treated embryos, compared with that in control embryos. (J) Time course percentage change in PSM size and L50 position in SU5402-treated embryos, compared with those in control embryos. Note that L50 analysis begins 1.5 h after SU5402 treatment when dpErk intensity has recovered (see Fig. 6I) because it cannot be defined earlier. (K) Time course analysis of her1 wavelength of untreated embryos and SU5402-treated embryos. We found no significant difference (significance threshold P<0.05) at any time point. (L-N) Simulation results for percentage increase of somite size over time, based on different models. After induction of one larger somite (arrowheads), the clock and wavefront model (when wavefront speed is associated with axis elongation only) predicts one smaller somite (L), the wavelength/Turing model (Cotterell et al., 2015) predicts smaller somites and the somite size eventually comes back to normal (M). Only the clock and scaled gradient model predicts the ‘echo effect’ that somite size dynamics oscillate repeatedly every four cycles (N).