
|
Fig. S3
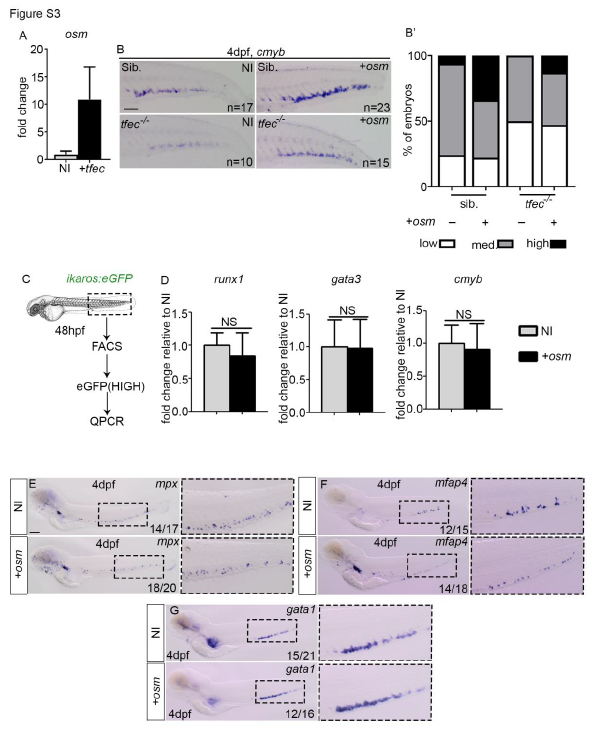
osm expression is tfec-dependent and reduces macrophage differentiation.
(A) qPCR analysis of osm expression in FACS sorted tail endothelial cells from flk1:eGFP at 48hpf from non-injected or embryos injected with tfec mRNA. qPCR data shown is the mean±SEM of three data points, calculated from three independent experiments. Each separate experiment was conducted in biological triplicates, then averaged to give a single value. (B) ISH analysis of cmyb expression in non-injected or osm injected siblings (Sib.) and tfec mutants. (B’) analysis of cmyb expression within the CHT. (C) Experimental outline. (D) qPCR analysis of runx1 (p=0.5441), gata3 (p=0.9650) and cmyb (p=0.0981) expression in ikaros:eGFPhigh cells FACS sorted at 48hpf. qPCR data shown is the mean±SEM of three data points, calculated from three independent experiments. Each separate experiment was conducted in biological triplicates, then averaged to give a single value. NI, non-injected control. +osm, osm full length mRNA injected embryos. Statistical analysis was completed using an unpaired, two-tailed Student's t-test. NS, p>0.05. (E-G) ISH analysis of mpx, mfap4, gata1 at 4dpf in NI or osm injected embryos. NI, non-injected control. +osm, osm full length mRNA injected embryos. All scale bars are 100μm.