
|
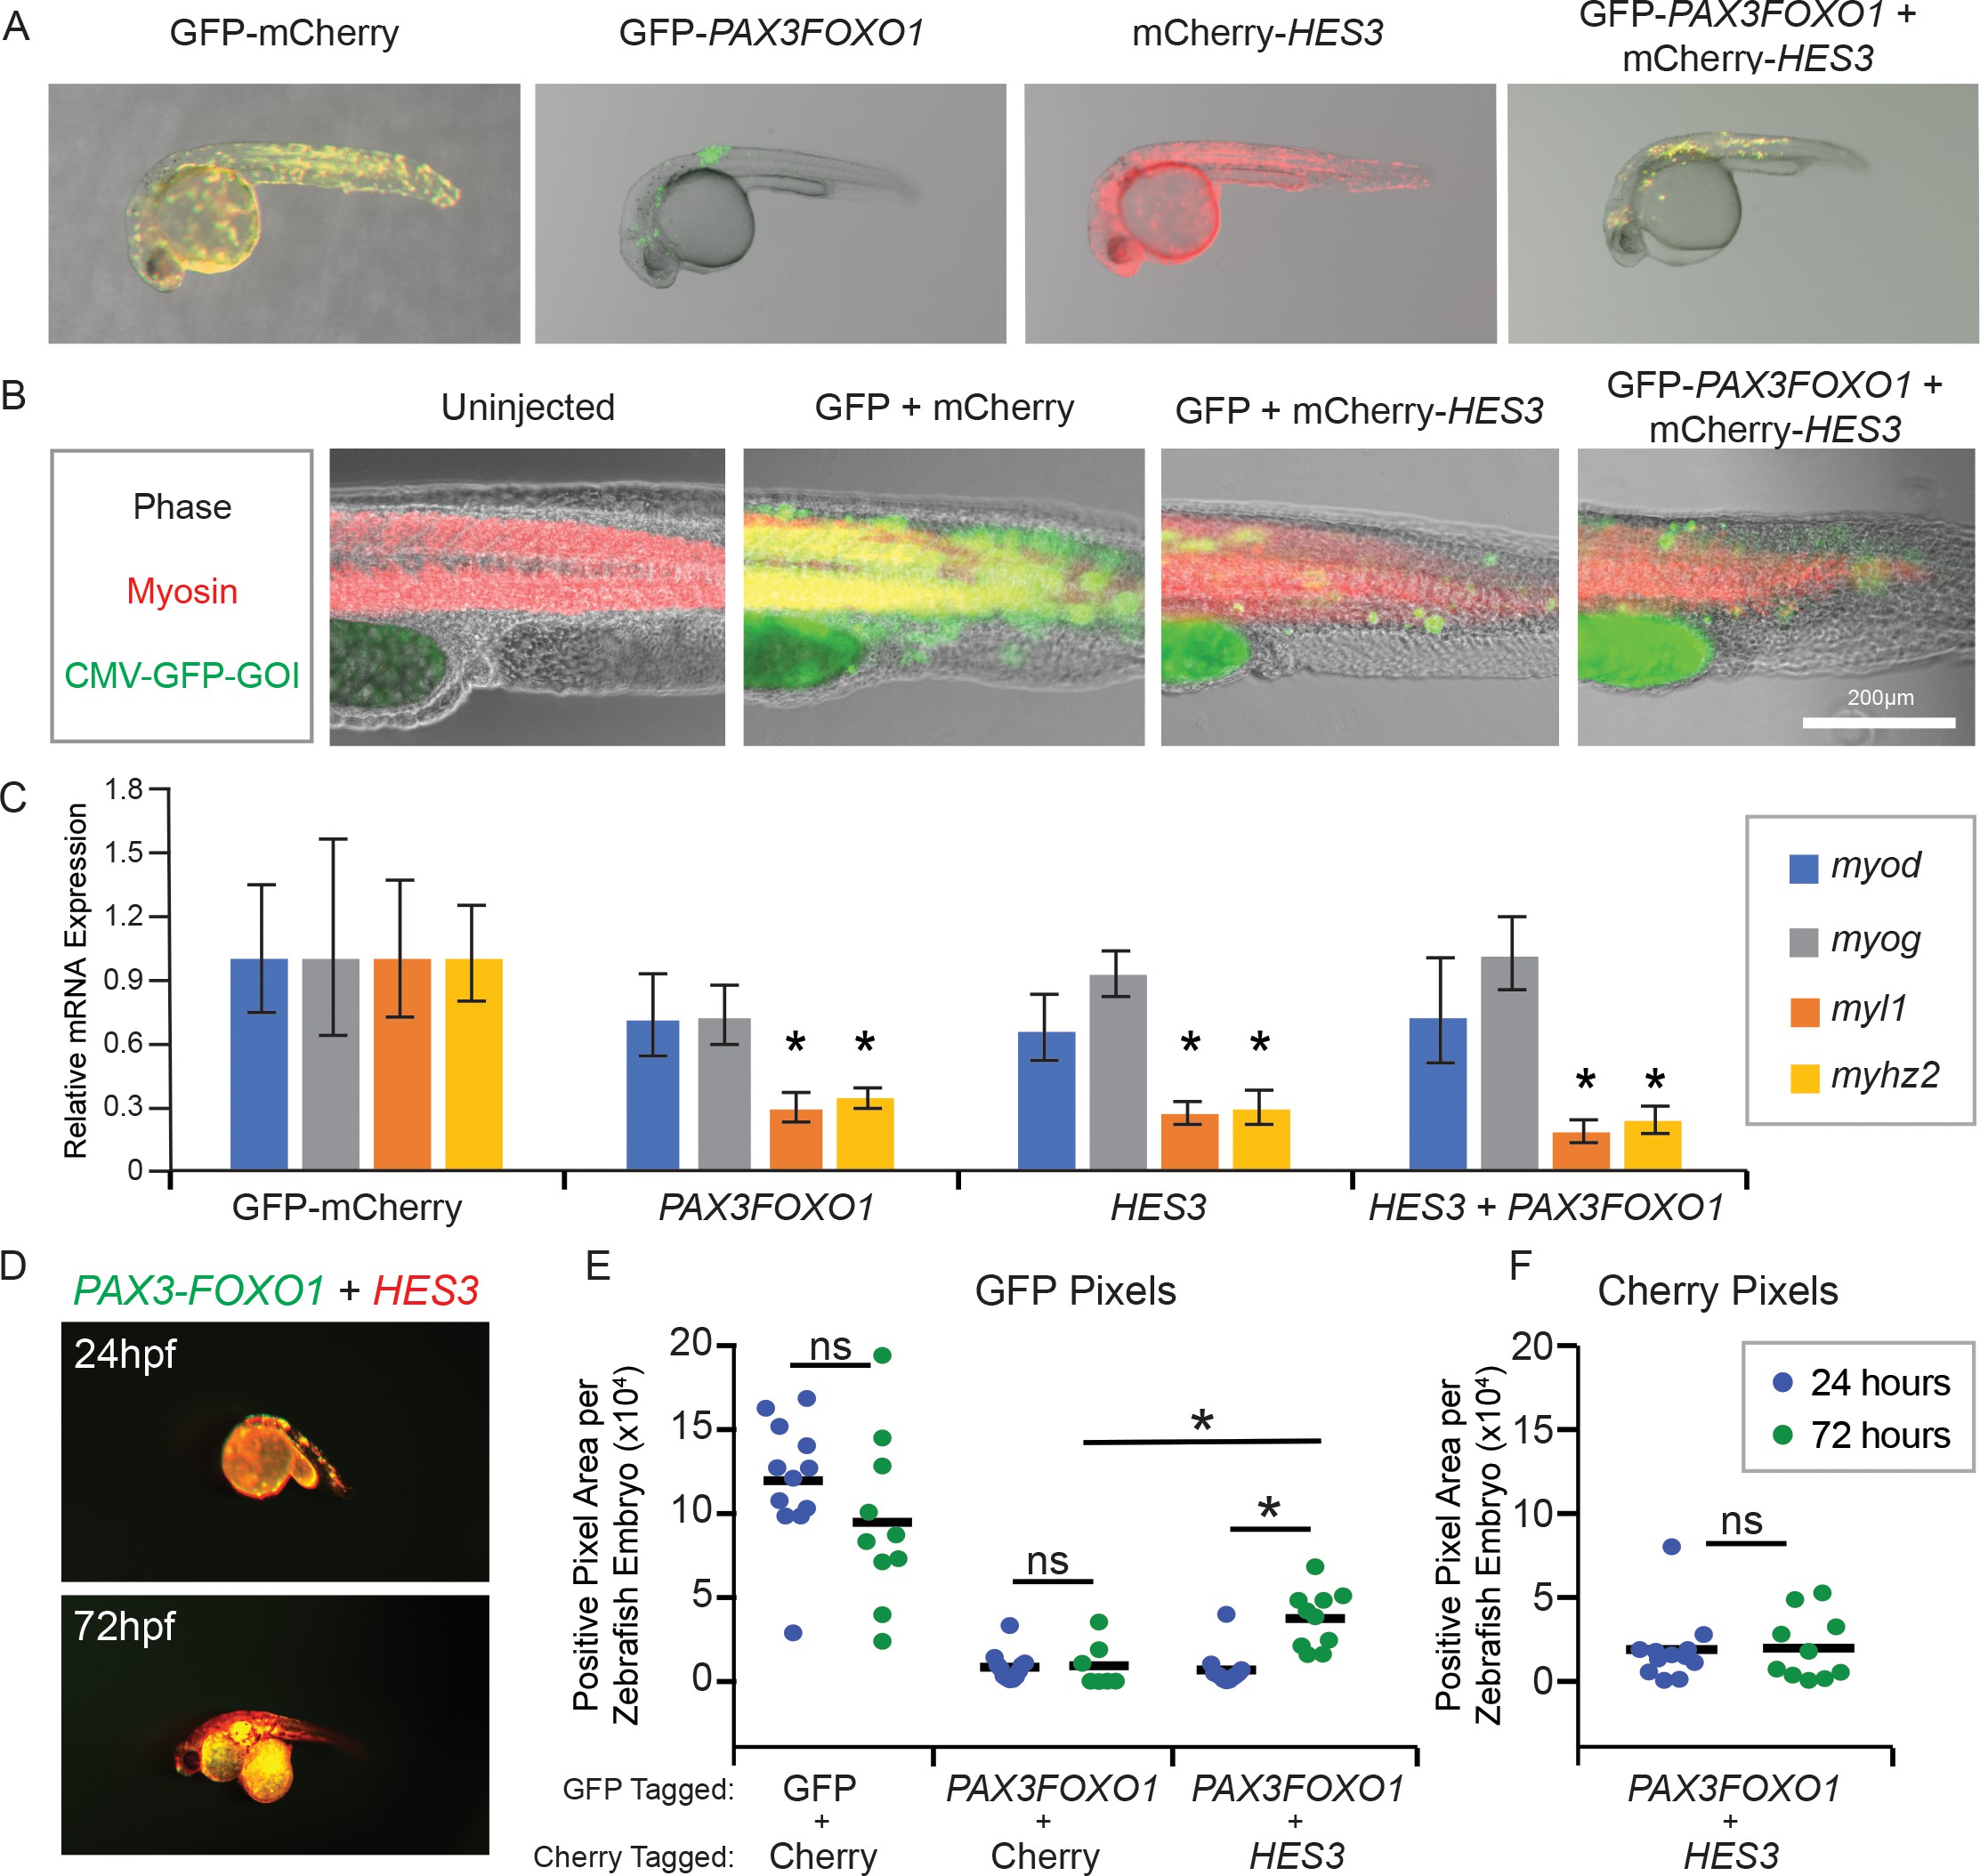
Fig. 4
HES3 inhibits myogenic differentiation in developing zebrafish and supports persistence of PAX3-FOXO1-positive cells.
(A) Zebrafish embryos were injected at the single-cell stage with the beta actin promoter driving GFP-Cherry, GFP-PAX3FOXO1, mCherry-HES3, or combined mCherry-HES3 and GFP-PAX3FOXO1. Shown are representative embryos at 24 hr post fertilization with indicated transgene expression. (B) Representative overlays of zebrafish embryo musculature that were fixed at 24 hr and immunofluorescence performed for myosin (red) and injected genes of interest (GOI; green). (C) Pools of n = 5 embryos were harvested at 24 hr and markers of myogenesis assessed by qRT-PCR, including myod, myog, myl1, and myhz2. SD is derived from technical triplicates. * indicates significant differences between treatment group and the GFP-mCherry control at a threshold of p<0.05, two-tailed Student’s t-test. (D) Representative overlay of images from co-injections of mCherry-HES3 and GFP-PAX3FOXO1 from the same embryo at 24 and 72 hr post-fertilization. Images were taken with the same exposure settings and objective. (E) Quantification of the number of positive pixels for each embryo imaged at 24 and 72 hr post-fertilization. GFP-positive pixels are plotted after the same settings are applied for imaging and analysis. Each marker represents a single zebrafish embryo at 24 or 72 hr post fertilization, n = 6–12 embryos per group. Black bar is the mean, and * indicates p<0.05, two-tailed Student’s t-test. ns- not significant. (F) Same analysis as in E but for mCherry positive pixels.