
|
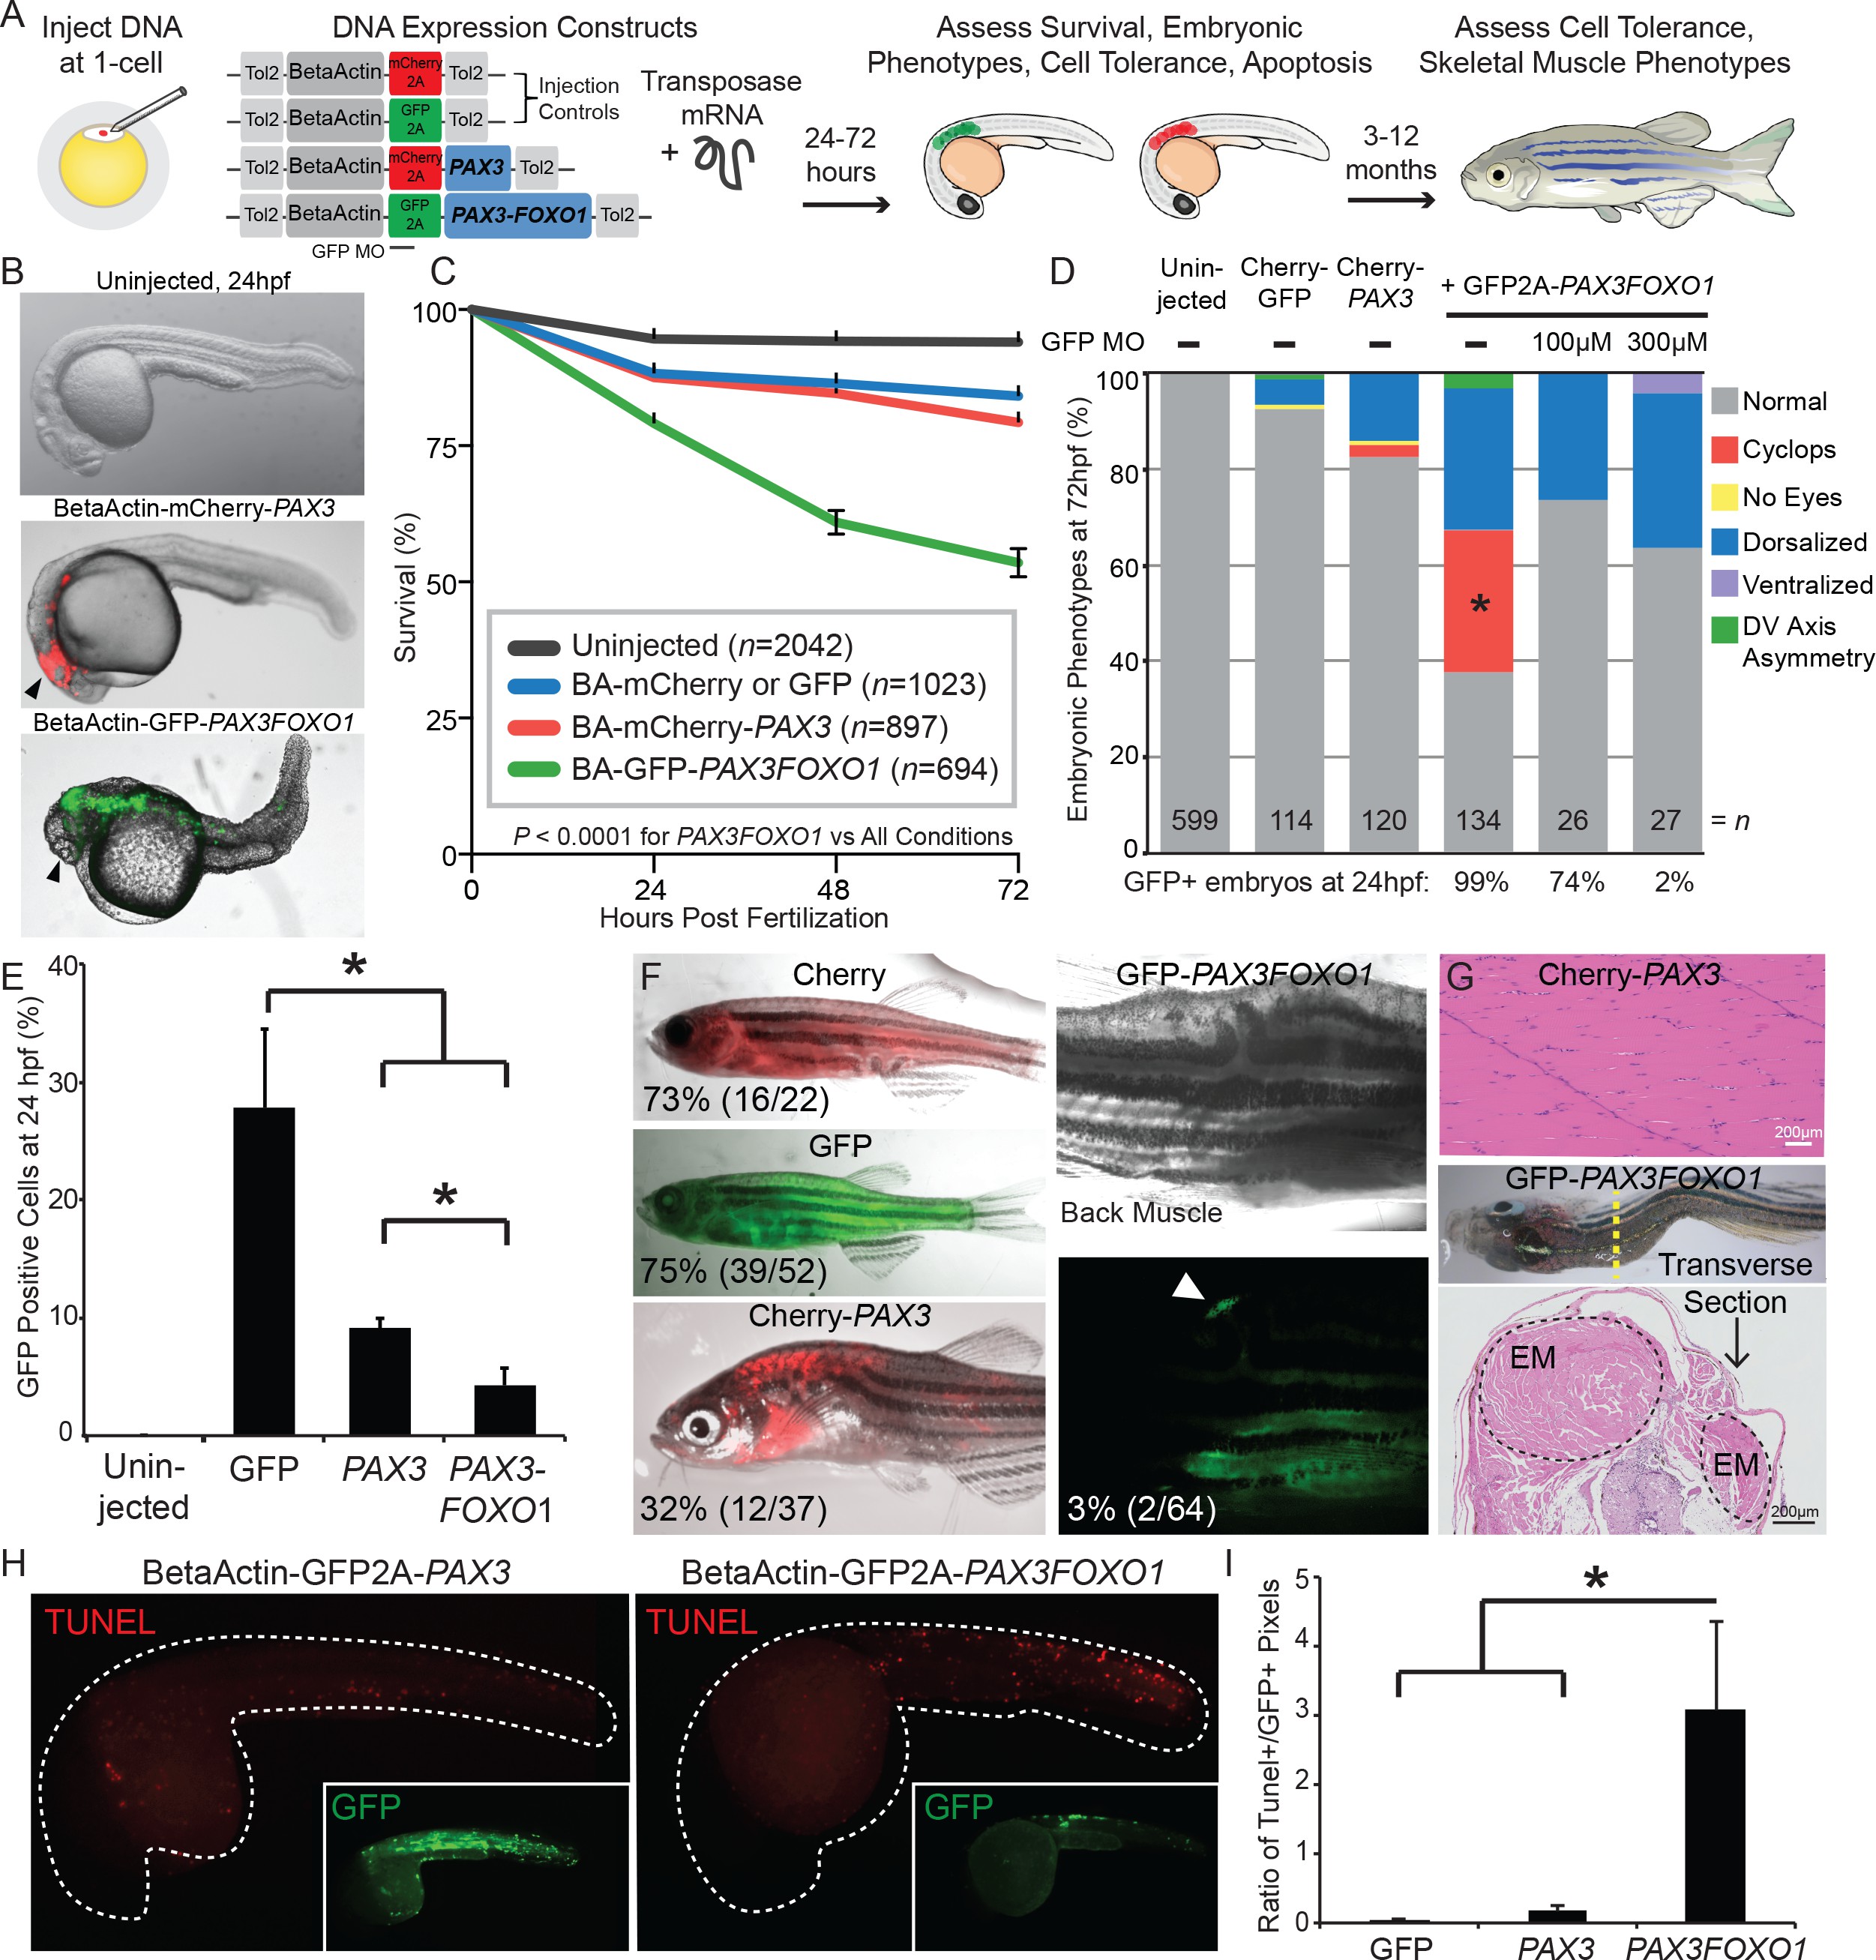
Fig. 2
PAX3 and PAX3-FOXO1 have distinct impacts and tolerance during embryonic development and in adult zebrafish.
(A) Strategy for assessing functional differences of beta-actin-driven PAX3 and PAX3-FOXO1 in a vertebrate system. (B) Representative images at 24 hr post-fertilization of Uninjected, mCherry2A-PAX3, and GFP2A-PAX3FOXO1-injected zebrafish. (C) Survival curve of Uninjected, GFP2A or mCherry2A injected controls, mCherry2A-PAX3, and GFP2A-PAX3FOXO1. Error bars represent SE. Log rank test, p<0.0001 for PAX3FOXO1 versus all other conditions. (D) Embryonic phenotypes scored at 3 days post-injection. * indicates p<0.05, for PAX3 vs PAX3FOXO1, Fisher’s exact test. MO- morpholino. DV- Dorso-Ventral. (E) Percentage of GFP + cells from dissociated zebrafish embryos as quantified by fluorescent activated cell sorting (FACS). Error bars represent SD across three independent experiments. * indicates p<0.05, two-tailed Student’s t-test. (F) Adult zebrafish over 3 months of age robustly expressed beta-actin-driven Cherry, GFP, or Cherry2A-PAX3 and developed normally. Zebrafish injected with BetaActin-GFP2A-PAX3FOXO1 displayed developmental defects or developed tumors. Arrow denotes GFP + area. The percentage indicates zebrafish with detectable fluorescence at adulthood. (G) Hematoxylin and eosin staining showed normal histology of BetaActin-PAX3 expressing skeletal muscle (sagittal section) at 299 days of age, and abnormal histology of BetaActin-PAX3FOXO1 epaxial muscle exhibiting dramatic left-right asymmetry (transverse section, asymmetry of left-right epaxial muscle (EM) marked by dotted lines) at 307 days of age. Scale bars, 200 microns. EM- epaxial muscle. (H) Representative images from zebrafish embryos injected with GFP2A-PAX3 and GFP2A-PAX3FOXO1 that are fixed at 24 hr post-injection and then TUNEL performed (rhodamine). Embryos were counter-stained for GFP to indicate transgene expression. (I) Quantification of TUNEL-positive pixels normalized to GFP positive pixels, indicated a higher proportion of PAX3-FOXO1 cells were undergoing apoptosis. Error bars represent SD, n = 6–8 embryos per group, * indicates p<0.05, two-tailed Student’s t-test.