
|
Fig. 2-S2
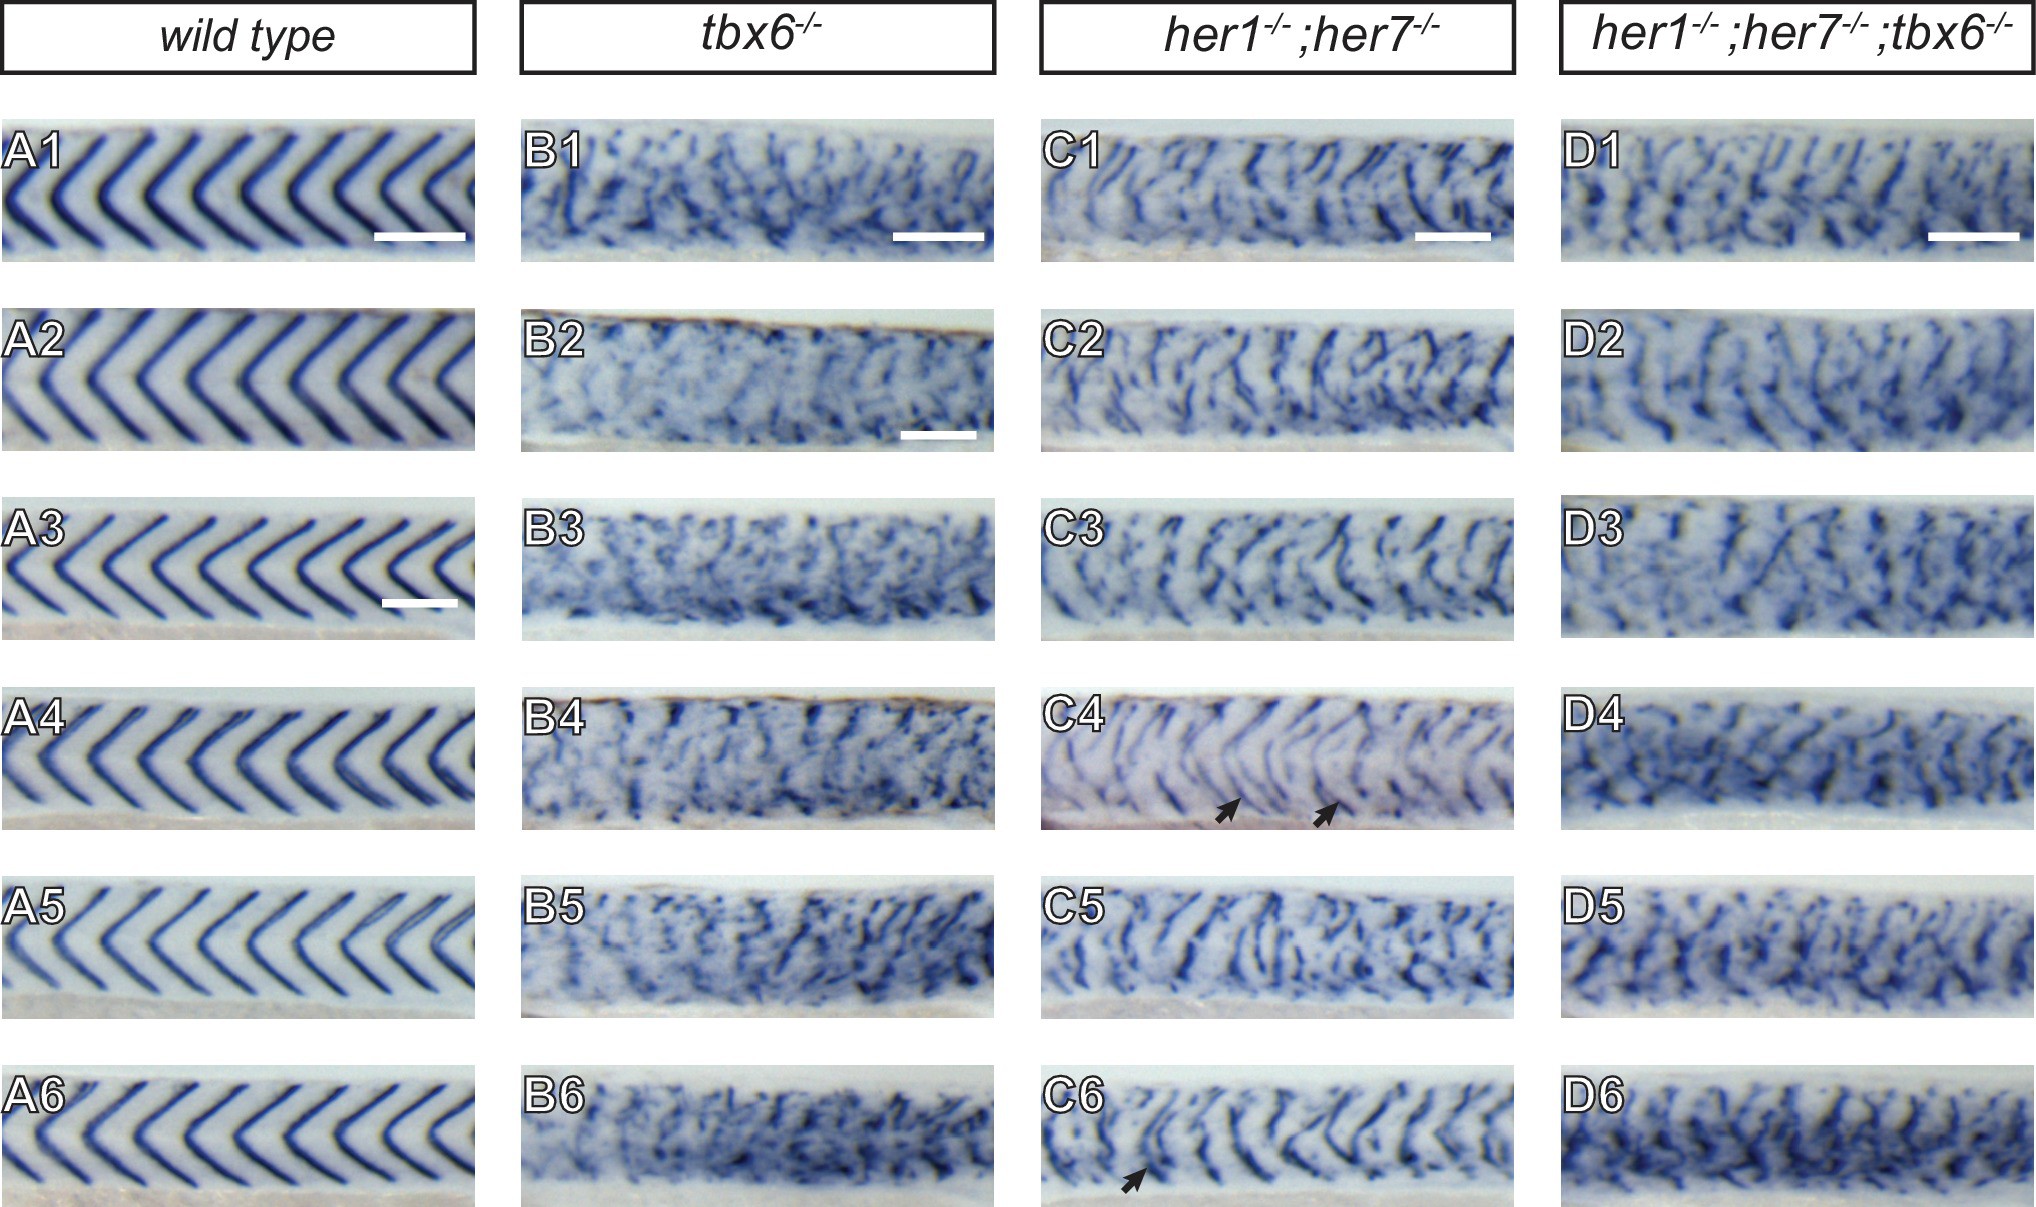
Severity of myotome boundary disruptions in tbx6, her1;her7 and her1;her7;tbx6 mutants differ according to genotype.
(A1–D6) In situ hybridisation for myotome boundary marker xirp2a in six representative embryos for each genotype. (A1-A6) In wild type larvae, xirp2a staining delimits periodic, chevron-shaped boundaries. (B1–B6) In tbx6−/−, myotome boundaries are either fragmented or indistinct and xirp2a staining is visible in most of the axis. (C1–C6) In her1−/−;her7 −/−, myotome boundaries are fragmented and scattered in the trunk. Occasional chevron-shaped boundaries can be observed (arrows in C4 and C6). (D1–D6) Myotome boundary disorder of her1−/−;her7−/−;tbx6 −/− resembles tbx6−/−. Scale bars are 100 µm. Scale bar in A1 applies to A1-2, in A3 applies to A3-A6, in B2 applies to B2-B6, in C1 to C1-6 and in D1 to D1-6. Larvae are 36–41 hpf, shown in lateral view with anterior to the left. Images are taken from trunk abutting the yolk extension, corresponding to ~segments 7 to 17 in .