
|
Fig. 2
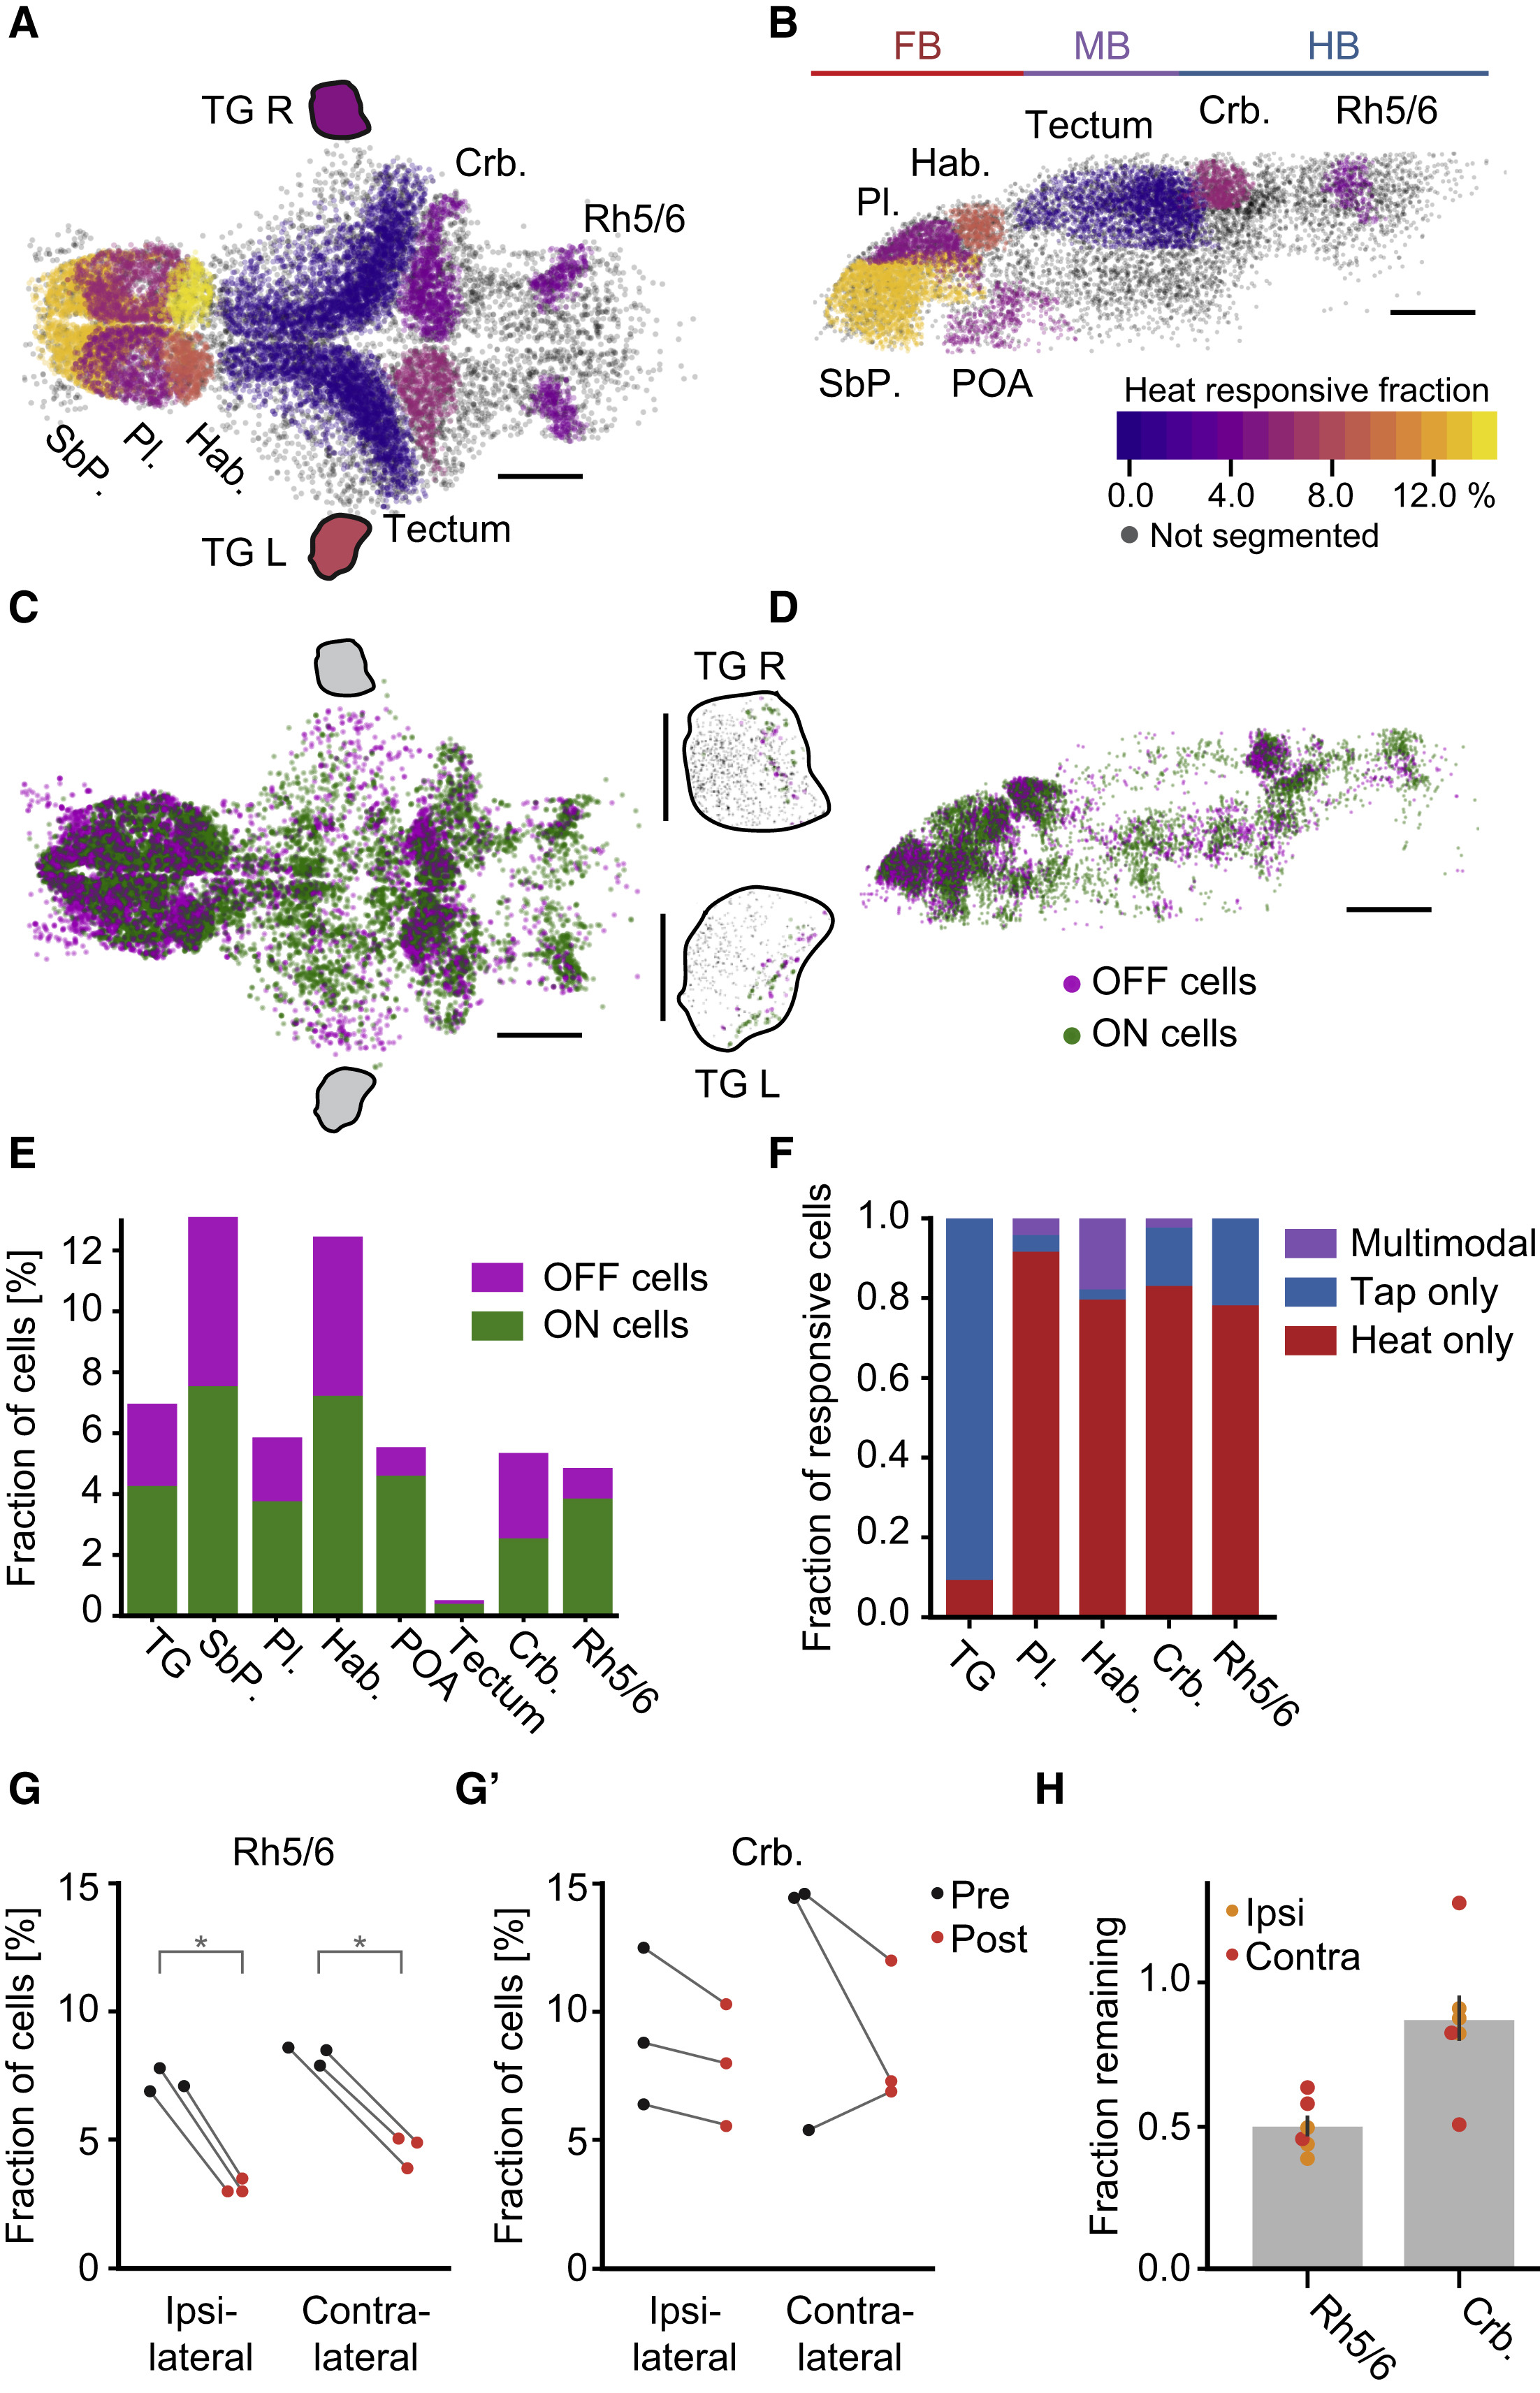
Heat-Related Activity Is Widespread across the Brain
(A and B) Fraction of heat-responsive cells within selected brain regions. Color scale indicates percentage of heat-sensitive cells within each region. Grey cells indicate brain regions that were not segmented. Scale bars, 100 μm. Pl.: pallium, SbP.: subpallium, Hab.: habenula, Crb.: cerebellum, Rh5/6: hindbrain rhombomeres 5 and 6, POA: preoptic area, TG L/R: left/right trigeminal ganglion. Colored lines on top delineate major subdivisions of the brain, FB: forebrain, MB: midbrain, HB: hindbrain. Note that trigeminal ganglia are not to scale.
(A) Dorsal view of the brain, anterior left, left side bottom.
(B) Side view of left hemisphere, anterior left, dorsal top.
(C) Distribution of ON (green) and OFF (magenta) cells across the zebrafish brain (top projection). The projection shows all cells identified across 30 individual experiments which have been registered onto a common reference brain. Scale bar, 100 μm, anterior left, left side bottom. Black outlines mark approximate location of trigeminal ganglia which are shown in insets to the right (TG L/R, left/right trigeminal ganglion). Each trigeminal ganglion depicts cells across five fish registered onto a common reference ganglion. Scale bar, 50 μm, anterior left.
(D) Side view of the brain in (C); only cells in the left hemisphere are depicted. Scale bar, 100 μm, anterior left, dorsal top.
(E) Fraction of heat ON cells (green) and heat OFF cells (magenta) in select brain regions.
(F) For regions that were imaged in heat and tap experiments, the fraction of stimulus-responsive cells that only responded to the heat stimulus (red), cells that only responded to the tap stimulus (blue) and multimodal cells that responded to both heat and tap (purple).
(G and G’) Effect of ablating one trigeminal ganglion on the fraction of heat-responsive neurons in each brain hemisphere in Rh 5/6 (G) and the cerebellum (G’) in three individual fish. Black dots show fraction of heat-responsive cells before and red dots after ablation. ∗ = p < 0.05, rank-sum test.
(H) Fraction of pre-ablation heat-responsive cells remaining after ablation across Rh 5/6 and the cerebellum. Bar indicates average with bootstrap standard error across six hemispheres. Orange dots indicate ipsilateral effect, red dots indicate contralateral.
See also Figure S2.