Fig. 2
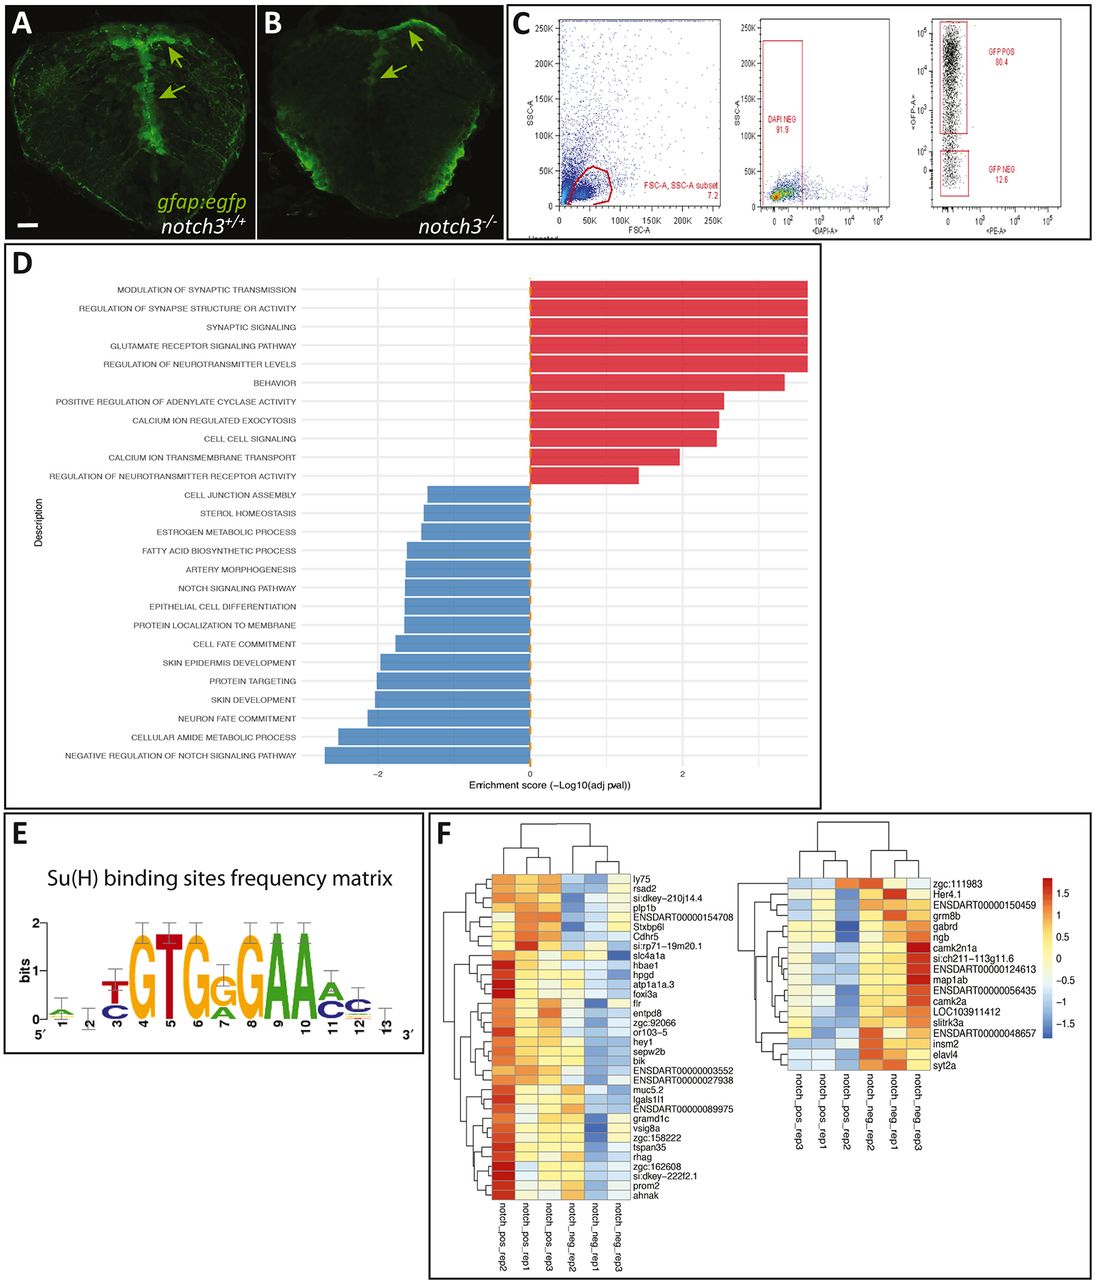
RNAseq identification of Notch3-dependent genes in 7 dpf radial glia. (A,B) Radial glia cells (RGs) (gfap:gfp, green, arrows) observed on cross-sections of the 7 dpf telencephalon in notch3+/+ and notch3−/− sibling larvae, used for FACS sorting. (C) Representative FACS dot plots showing the gating strategy. FSC/SSC plot and selected cells, which are then gated for DAPI negativity (middle panel) and for GFP expression (right panel). (D) List of significantly enriched GO terms (ordered by enrichment score) within the list of DEGs in 7 dpf RGs between notch3−/− and wild-type sibling larvae (red, enriched in mutants; blue, enriched in wild type) (see also Table S4). (E) Position-weight matrix for RBPJ/Su(H)-binding sites used in the present study (graphical representation). (F) Heat maps of the genes down- or upregulated in notch3−/− compared with notch3+/+ larvae and harbouring putative RBPJ-binding sites. Cutoff on display: log(fold change)>1. See also Tables S1 and S2. Scale bar: 20 µm.

