
|
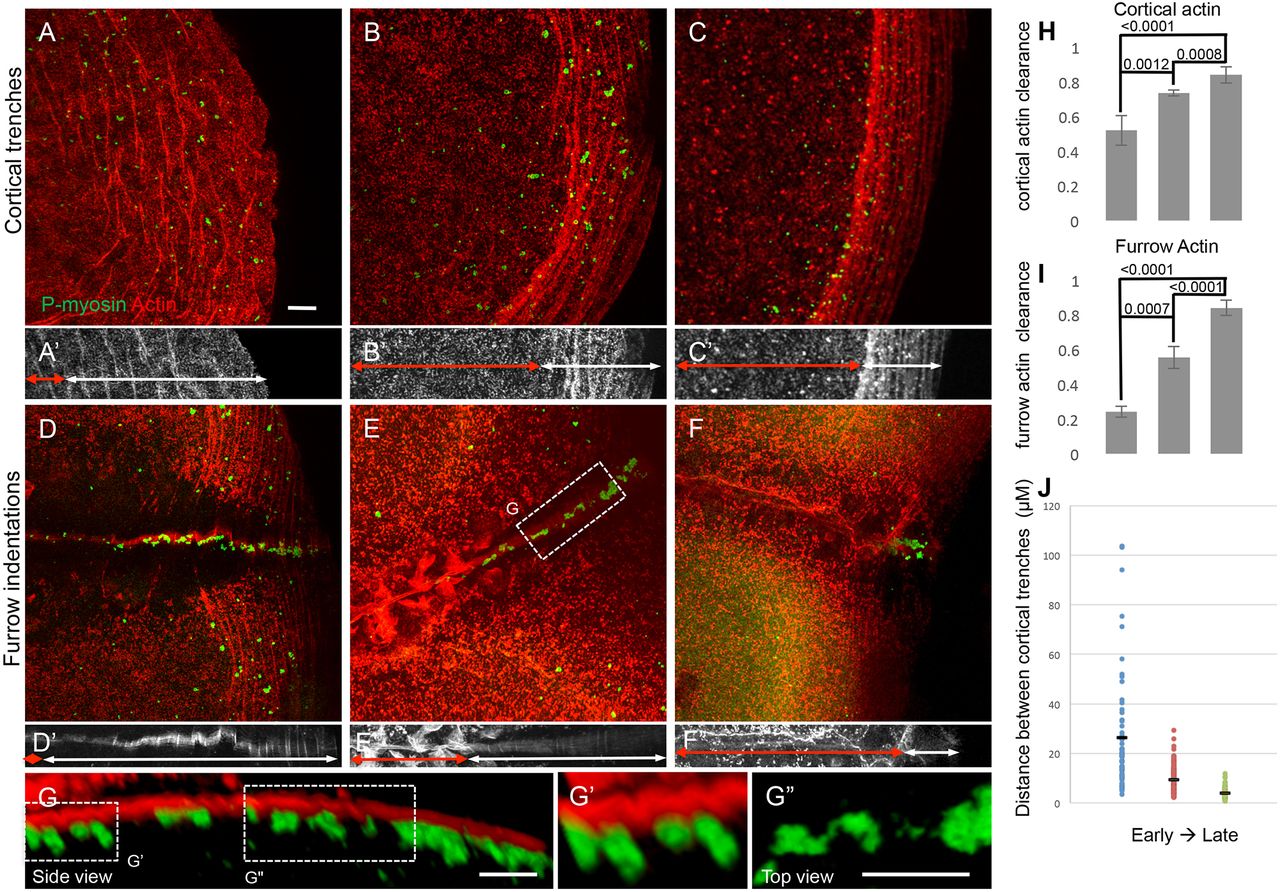
Fig. 8
F-actin cortical trenches and furrow indentations exhibit a directional progression and are associated with germ plasm RNPs. (A-C) Wild-type embryos fixed prior to furrow formation (A, 35 mpf; B, 50 mpf; C, 65 mpf; animal with blastodisc center to the left and blastodisc periphery to the right). F-actin arcs, associated with RNP aggregates, move outwards as they form a more-dense network. A′-C′ highlight the region of F-actin arcs (white double-headed arrows) and the distance from the center of the blastodisc to the inner rim of the F-actin arc region (red double-headed arrows). (D-F) Wild-type embryos fixed during furrow formation (D, 35 mpf; E, 50 mpf; F, 65 mpf; animal view with furrow medial region to the left and furrow distal end to the right). The region containing RNPs, which progressively becomes more distally restricted, corresponds to that exhibiting F-actin furrow indentations, as revealed by orthogonal views (D′-F′). In D′-F′, white double-headed arrows encompass the region with F-actin indentations and red double-headed arrows the more medial region with F-actin of an even and wider span, and with a punctate appearance, which likely correspond to the forming cell adhesive wall (Jesuthasan, 1998; Urven et al., 2006). (G) Orthogonal view of the furrow showing association of RNP aggregates with F-actin furrow indentations. (G′) RNP aggregates wedged within cytoplasmic spaces between indentations. (G″) An apparent stream of individual RNPs between larger aggregates (rotated as a top view for better visualization). In all images, RNPs (P-myosin) are in green and F-actin is in red, except the RNP and F-actin channels have been omitted for clarity in A′-F′ and G′′, respectively. (H) Quantification of cortical actin clearance as the ratio of the distance from the center of the blastodisc to the region of cortical F-actin trenches (red double-headed arrows in A′-C′) over the blastodisc radius. (I) Quantification of furrow actin clearance as the distance from the center of the furrow to the region of furrow F-actin indentations (red double-headed arrows in D′-F′) over the half-length of the furrow. (J) Quantification of the distance between individual F-actin arcs (distance between their peak intensity) within the blastodisc arc region (double-headed arrows in A′-C′), showing increasing density of F-actin network during its peripheral restriction. Significance was determined using an unpaired t-test. Data are mean±s.e.m. Scale bars: 10 μm.