
|
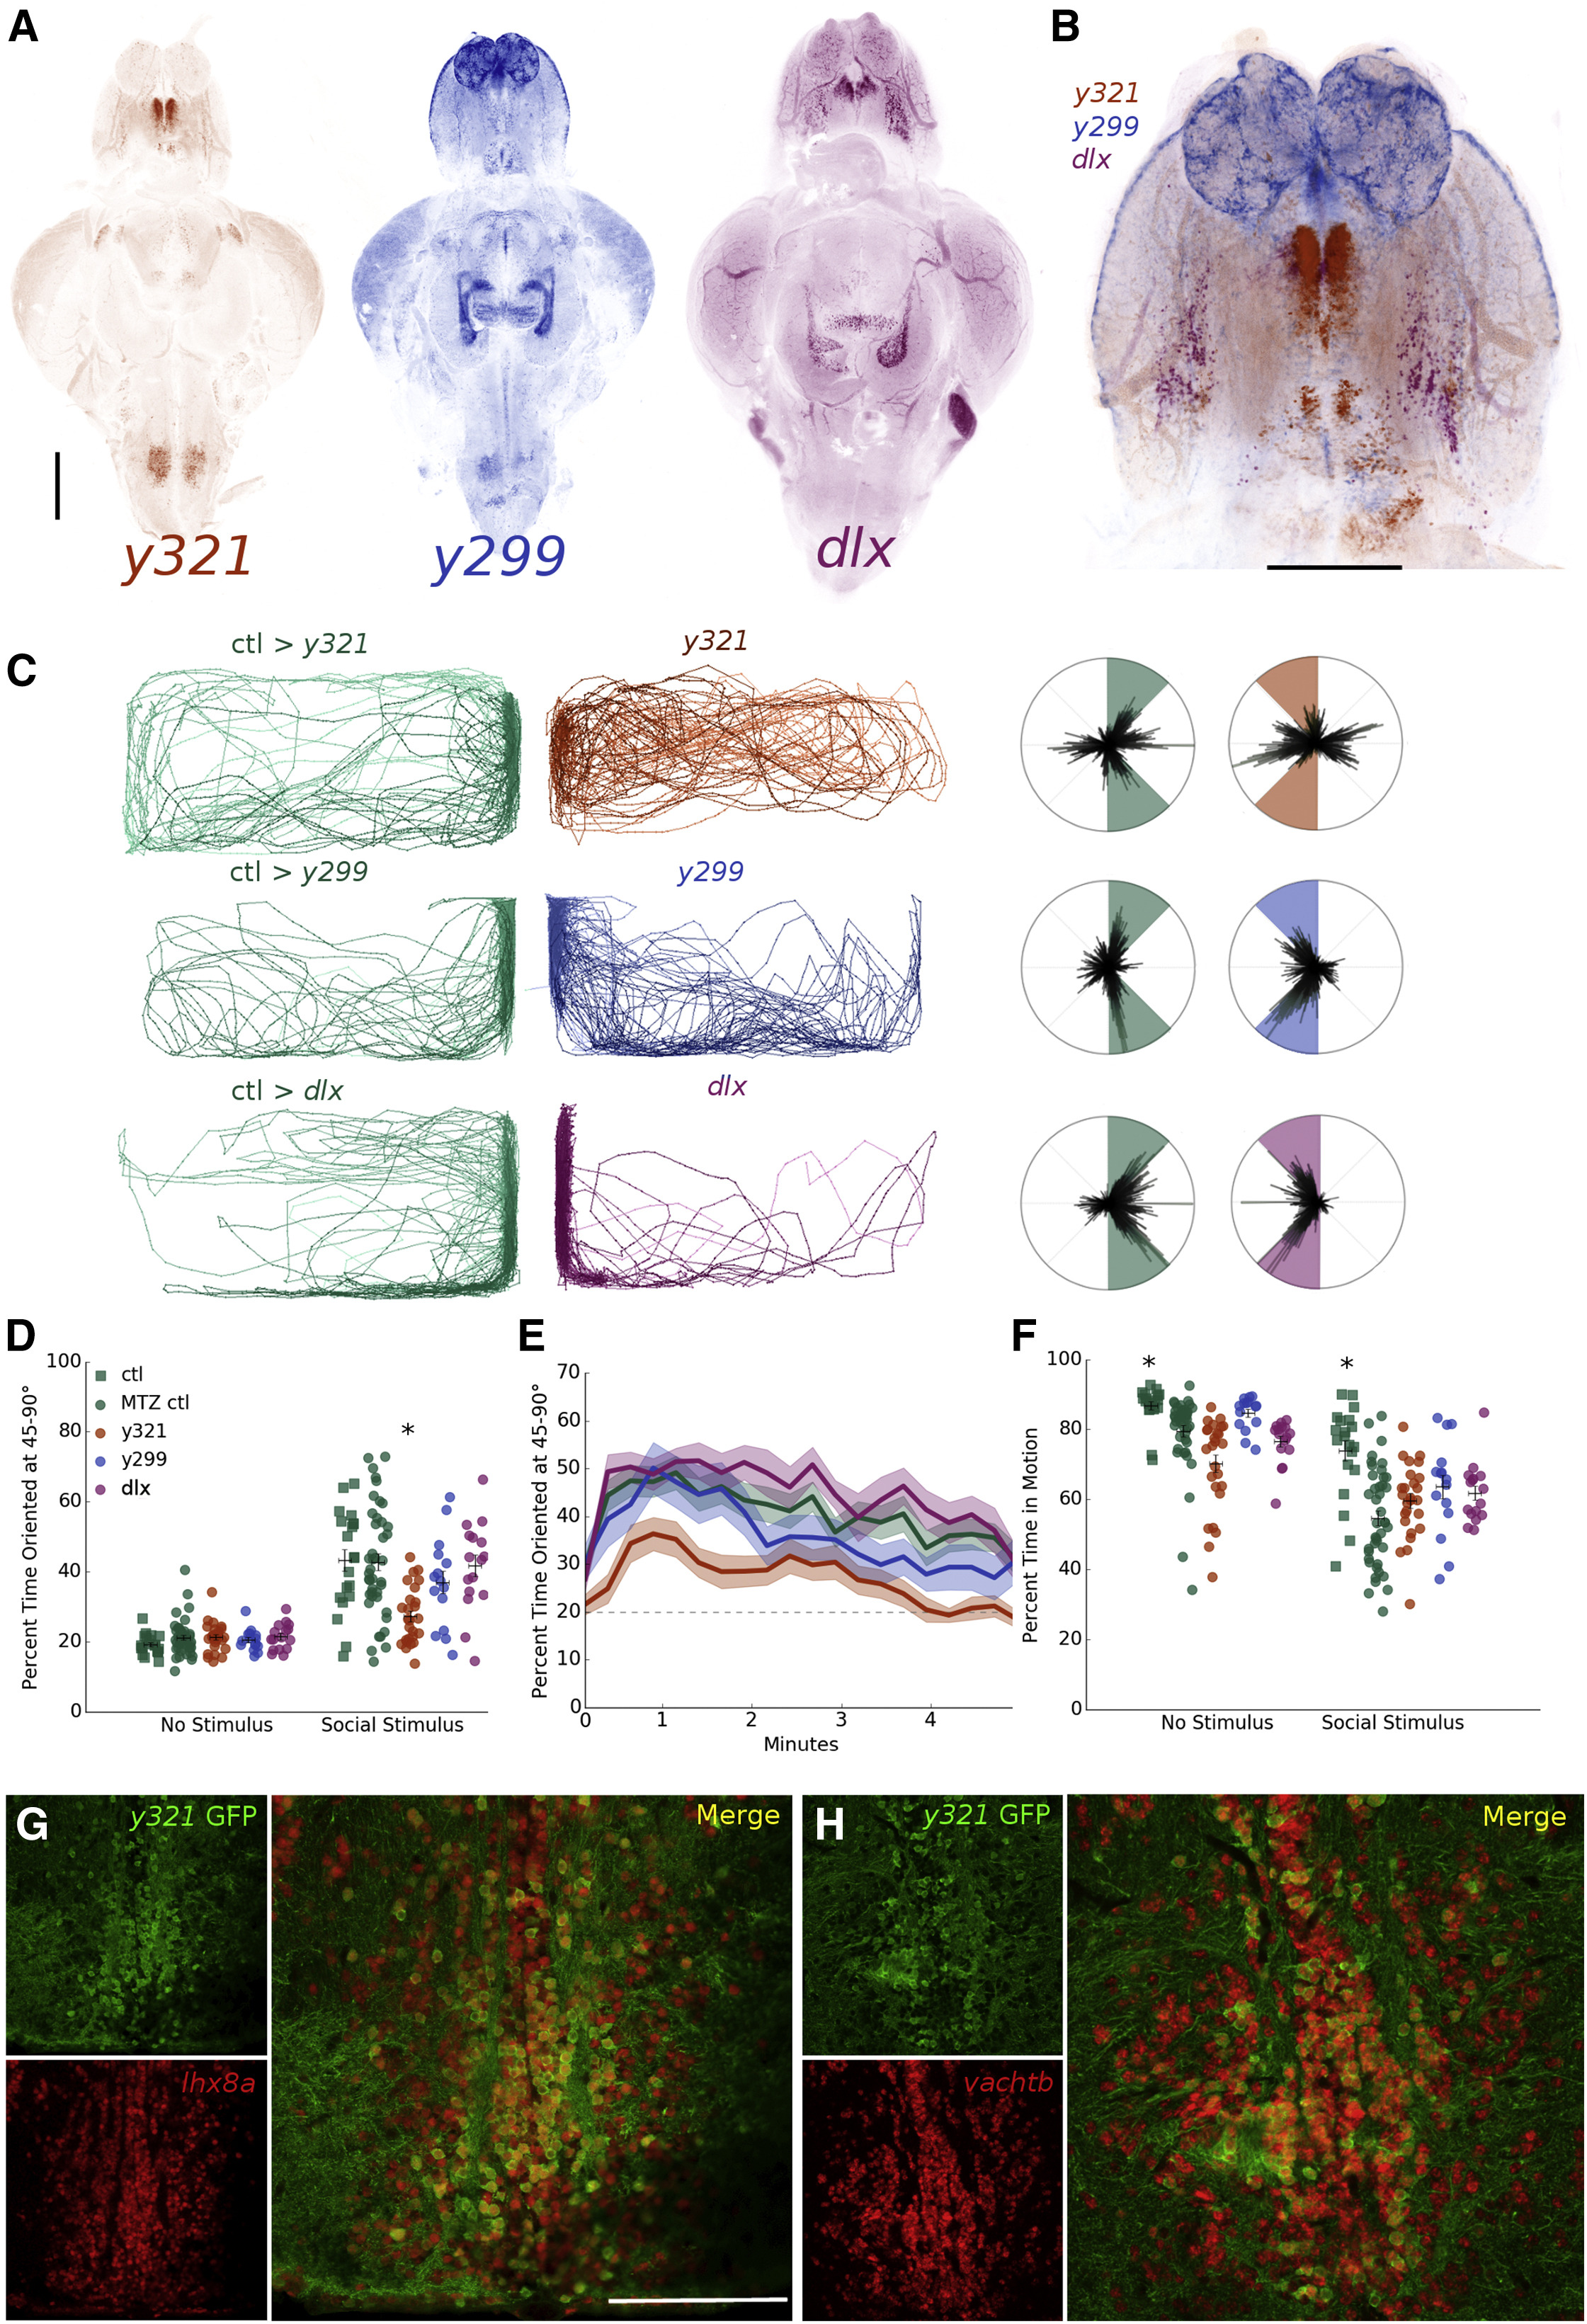
Fig. 4 Chemo-genetic Ablation of Cholinergic Neurons in the Ventral Telencephalon Disrupts Social Orienting (A) Whole-brain z projections of transgenic expression in y321, y299, and dlx gal4 lines. Scale bar, 200 μm. (B) Z-projection overlay of registered brains showing expression overlap and differences in the telencephalon. Scale bar, 200 μm. (C) Representative traces and polar histograms of y321, y299, and dlx lines following nitroreductase ablation of transgene-expressing cell populations. (D) Average percent time oriented at 45°–90° for chemo-genetic ablation experiments before and after social stimulus presentation. ∗p < 0.05, repeated-measures mixed model ANOVA with post-hoc simple effects tests. Horizontal bars, mean; vertical bars, ± SEM. (E) Percent time oriented over 5 min period for chemo-genetic ablation experiments. (F) Percent time in motion for all ablation groups before (no stimulus) and after (social stimulus) social stimulus presentation. ∗p < 0.05, repeated-measures mixed model ANOVA with post-hoc simple effects tests. Horizontal bars, mean; vertical bars, ± SEM. (G) In situ hybridization images of y321:gal4;UAS:GFP neurons labeled for lhx8a transcripts. Scale bar, 100 μm. (H) In situ hybridization images of y321:gal4;UAS:GFP neurons labeled for vachtb transcripts.