
Fig. 2
- ID
- ZDB-IMAGE-180725-19
- Publication
- Berrun et al., 2018 - Isthmin 1 (ism1) is required for normal hematopoiesis in developing zebrafish
- All Figures
- Figures for Berrun et al., 2018
|
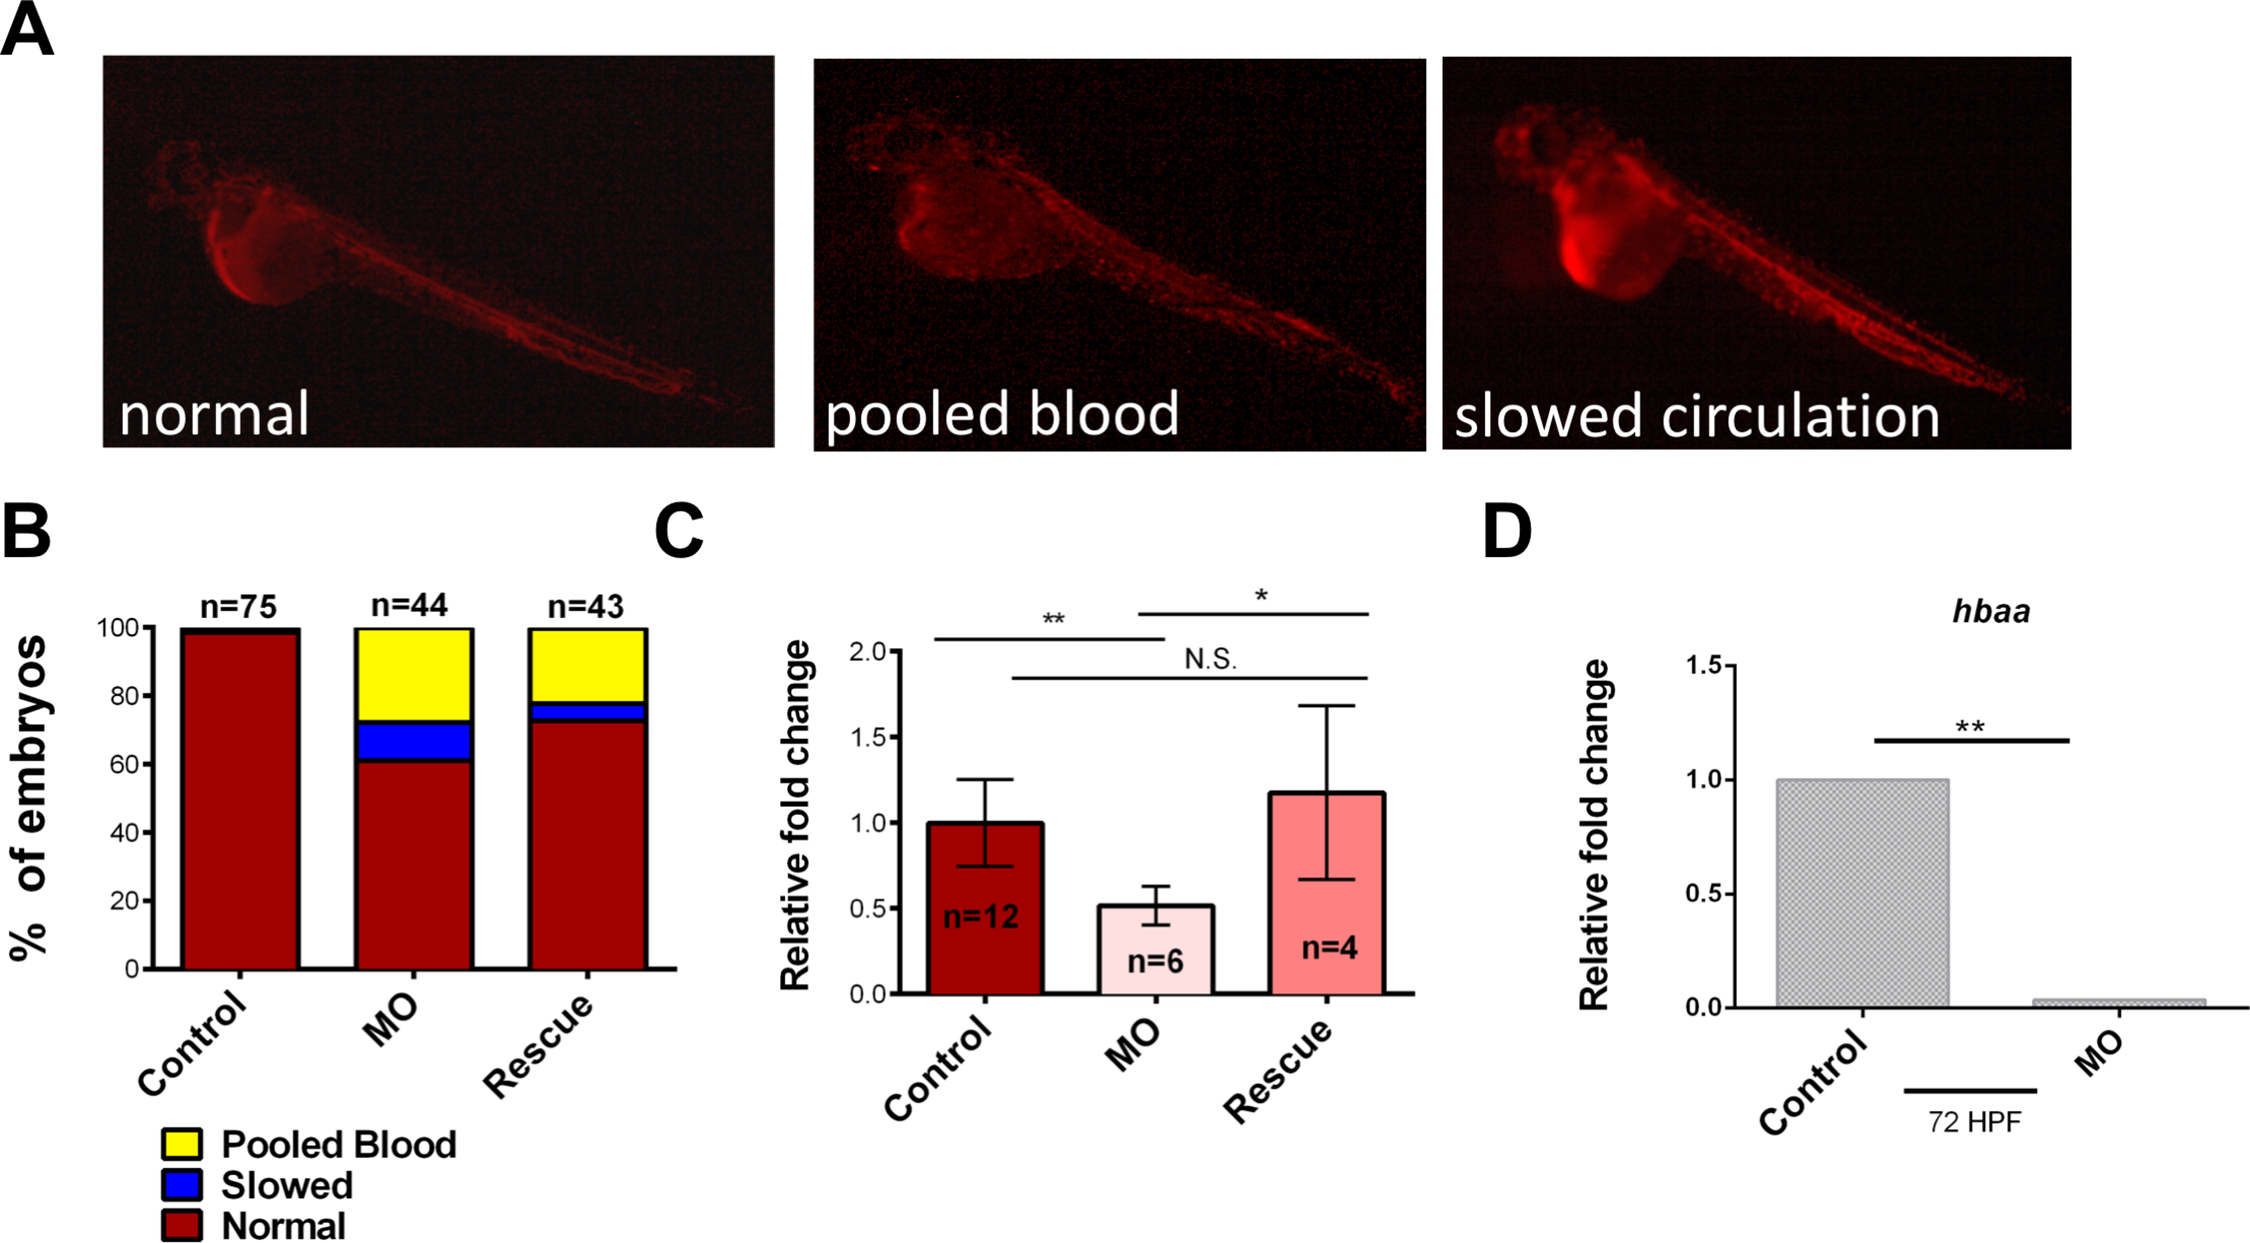
Fig. 2
ism1 knockdown decreases erythrocytes.
gata1:DsRed zebrafish embryos were injected at the single-cell-stage with 7 ng ism1 MO (MO), or 7 ng ism1 MO and 17.88 ng of ism1 mRNA (Rescue); uninjected embryos served as controls. (A) 24 hpf zebrafish visualized at 5x that have normal (left), pooled blood (middle), and slowed circulation (right) phenotypes. (B) Quantitation of zebrafish shown in (A); pooled blood (yellow), slowed circulation (blue), and normal (red) phenotypes. (C) Flow cytometry results quantitating gata1:DsRed+ erythrocytes in uninjected (control; red), ism1 MO injected (MO; peach), and ism1 MO with ism1 mRNA (Rescue; pink) 72 hpf zebrafish. (D) qRT-PCR was performed comparing transcript levels of hbaa in ism1 MO injected (MO) and uninjected controls (control). Bars represent the mean, and error bars represent standard deviation. Data was normalized as fold change over control and analyzed using a two-tailed unpaired Student’s T test. * denotes p<0.05, ** denotes p<0.0001, N.S indicates no significance.