
|
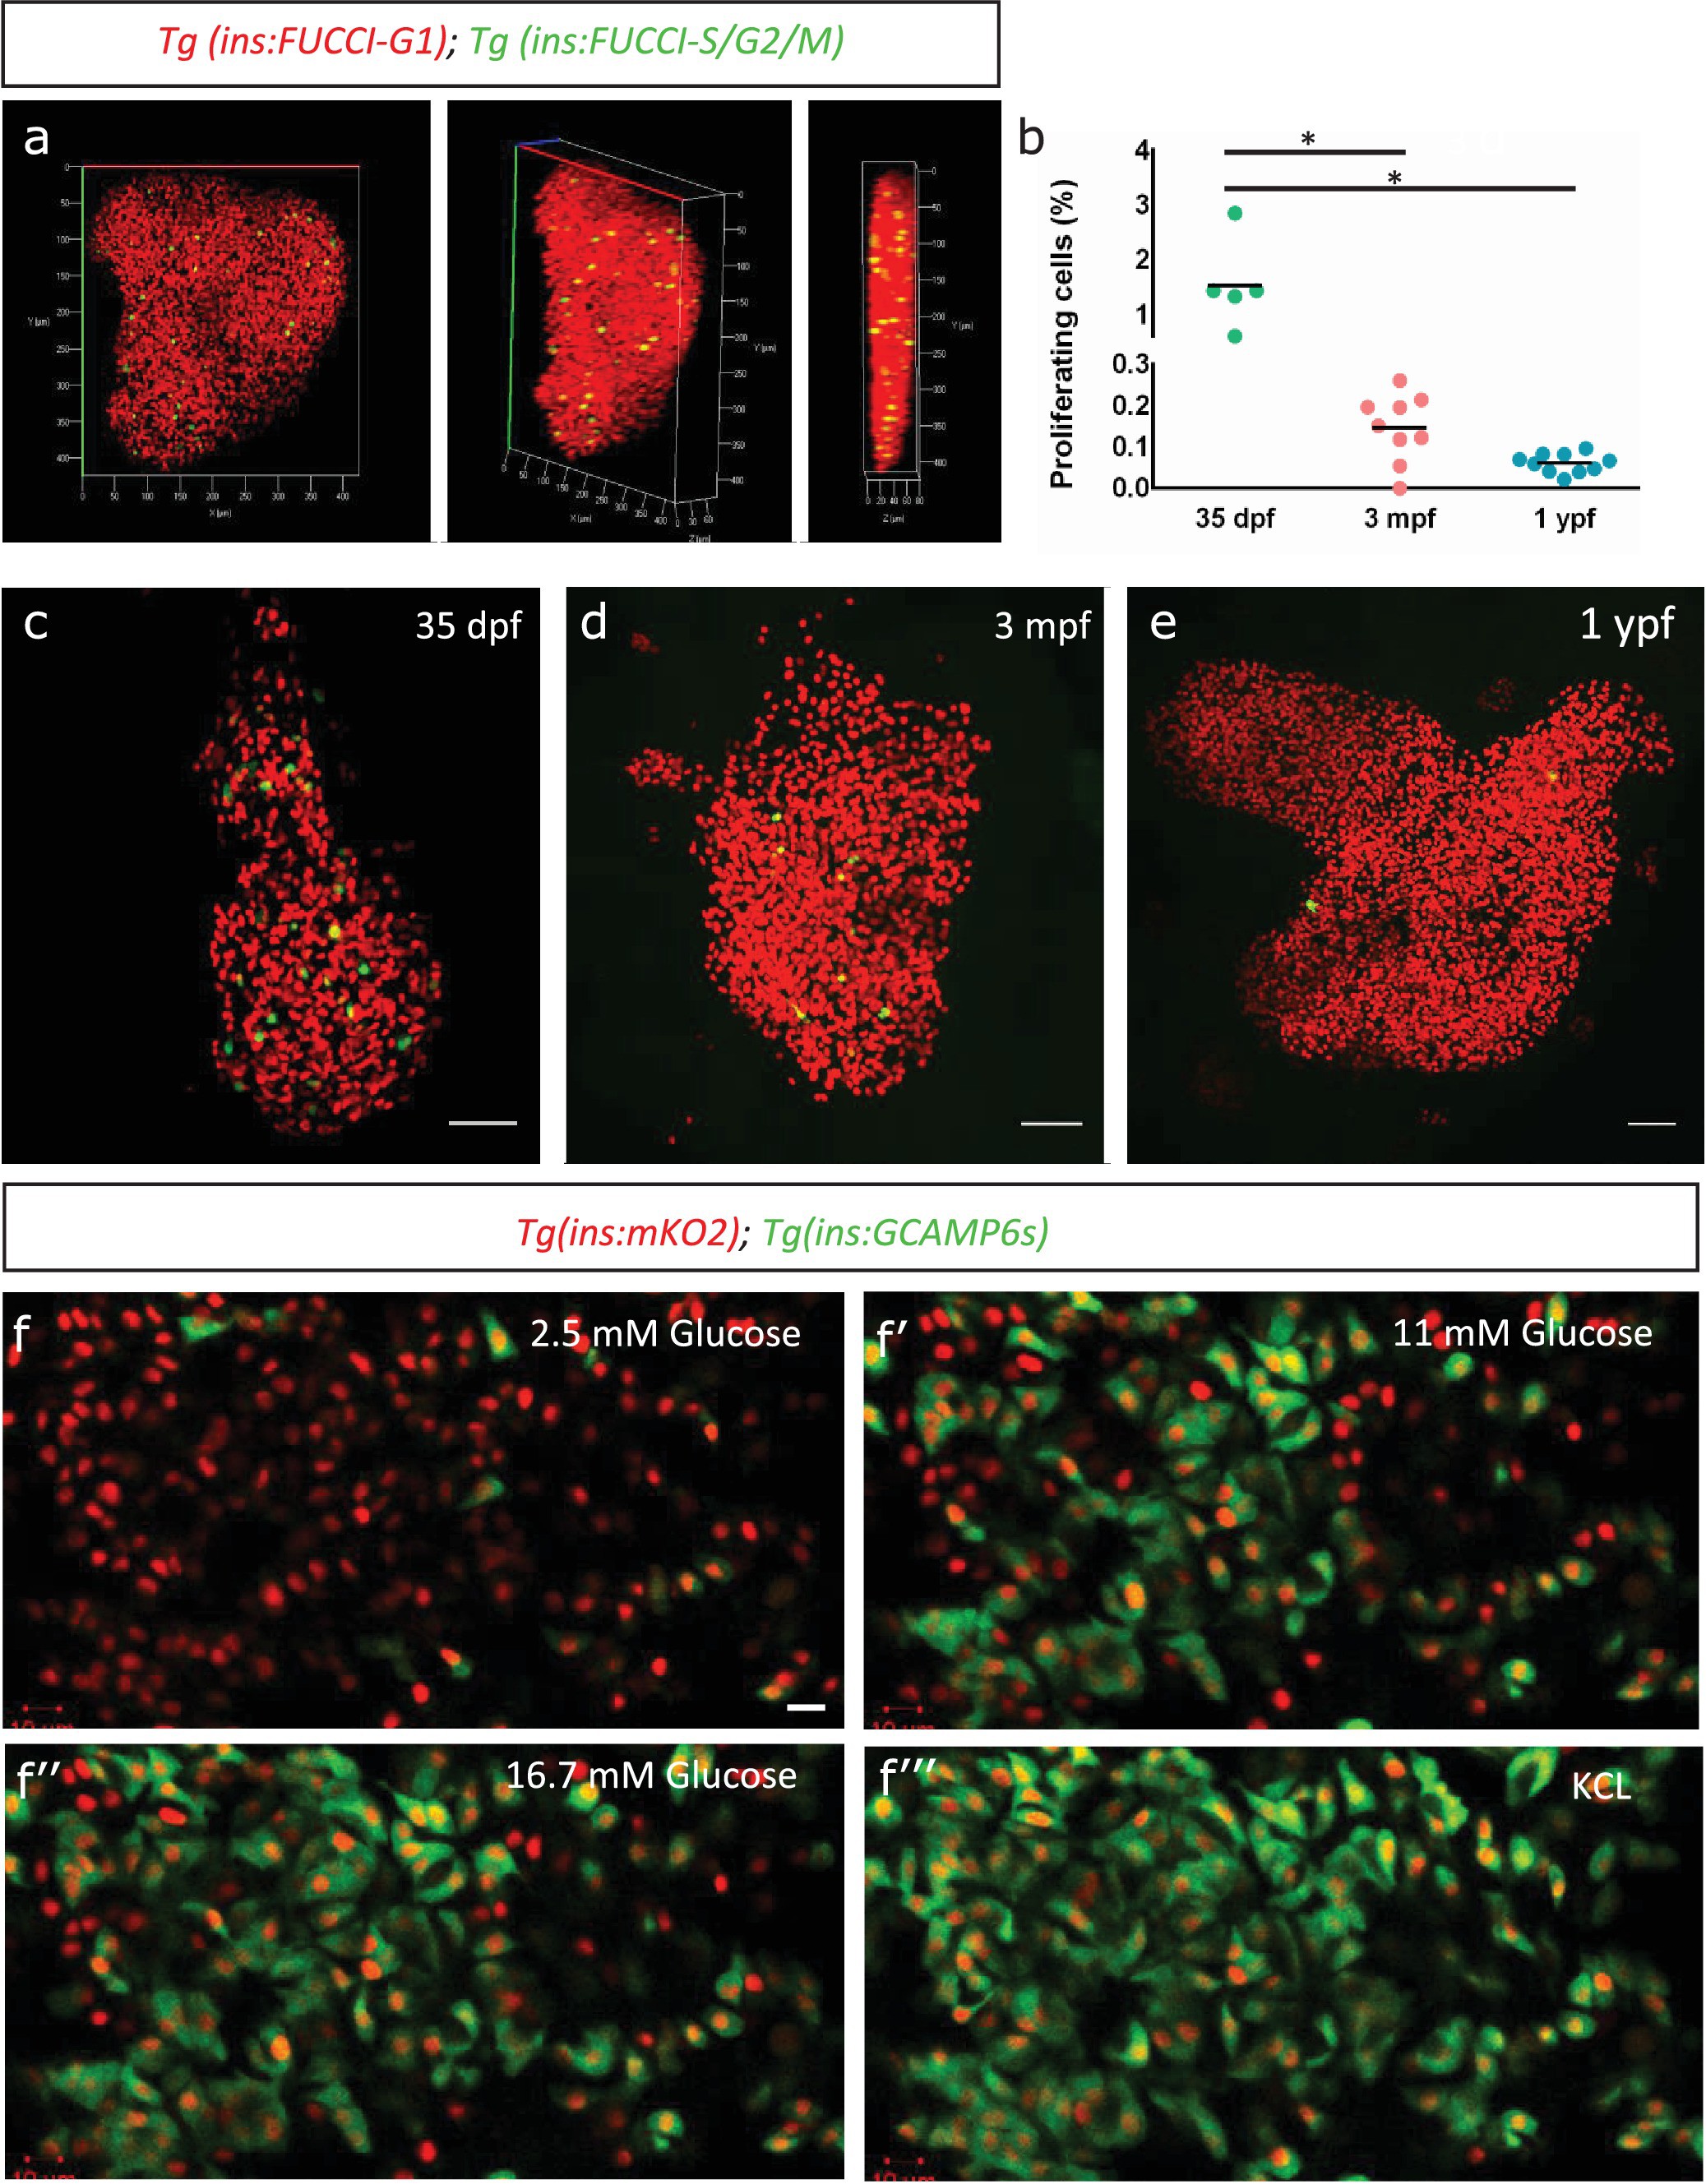
Fig. 1
Beta-cell proliferation declines with age.
(a) 3D-rendering of a primary islet from Tg(ins:Fucci-G1);Tg(ins:Fucci-S/G2/M) animals at 3 mpf showing nuclear Tg(ins:Fucci-G1) (red) and Tg(ins:Fucci-S/G2/M) (green) expression. (b) Quantification of percentage of Tg(ins:Fucci-S/G2/M)-positive and Tg(ins:Fucci-G1)-negative (green-only) beta-cells at 35 dpf (n = 5), 3 mpf (n = 9) and 1 ypf (n = 10) animals. Each dot represents one animal. Horizontal bars represent mean values (one-way ANOVA, *p<0.05). (c, d, e) Confocal projection of whole-mount islets from Tg(ins:Fucci-G1);Tg(ins:Fucci-S/G2/M) animals at 35 dpf, 3 mpf and 1 ypf. Anterior to the top. Scale bar 50 µm. (f) Ex vivo live-imaging of beta-cells from Tg(ins:nlsRenilla-mKO2);Tg(ins:GCaMP6s) animals at 3 mpf. Beta-cells (red) were stimulated with 2.5 (basal) mM D-Glucose, (f’) 11 mM D-glucose, (f’’) 16.7 mM D-glucose and (f’’’) depolarized using 30 mM KCl while monitoring GCAMP6s-fluorescence (green). Scale bar 10 µm.