
|
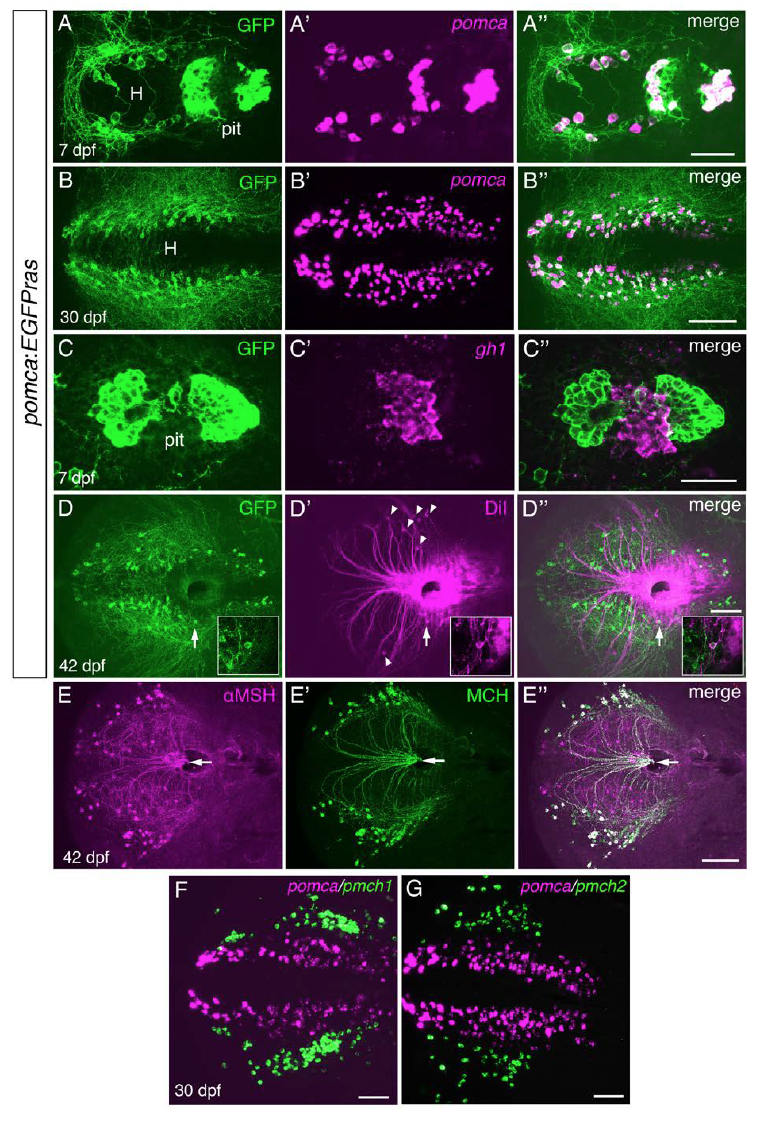
Fig. S2
pomca:EGFPras transgenic zebrafish recapitulate endogenous pomca expression and reveal absence of adenohypophyseal innervation. Related to Figure 3.
(A-D’’) pomca:EGFPras transgenic line. (A-B’’) Fluorescent in situ hybridization (FISH) for pomca (magenta) followed by anti-GFP immunofluorescence (IF; green). All Pomca cells in hypothalamus (H) and pituitary (pit) are GFP+ at 7dpf. (B-B’’) Colocalization of pomca transcripts and GFP in the hypothalamus at 30 dpf. (C-C’’) FISH for gh1 (magenta) and GFP IF (green) at 7 dpf revealing absence of Pomca cell-derived axons in regions of somatotropic cells of the pituitary. (D-D’’) DiI injection into the pituitary at 42 dpf labels various hypothalamic neurons lateral to the Pomca cell domain (arrowheads). In three analyzed brains, only one single Pomca neuron (GFP+; arrow) was found to be co-labeled with DiI tracer (see D-D’’ insets with magnified views). (E-E’’) Co-IF for αMSH and MCH at 42 dpf reveals cross-reactivity of the anti-αMSH antibody with MCH peptide. All projections towards the pituitary (arrows) are double-positive and thus derived from MCH neurons. (F-G) Double FISH for pmch1 (E, magneta) or pmch2, (F, magneta) and pomca (green) in wild-type brains at 30 dpf. Both pmch1 and pmch2 expressing cells are located lateral to the Pomca cell domain, most likely corresponding to the αMSH+ but GFP- cell bodies in (E). Scale bars: (A’’) 50 μm, (B’’) 100 μm, (C’’) 50 μm, (D’’, E’’, F, G) 100 μm.