
|
Fig. S1
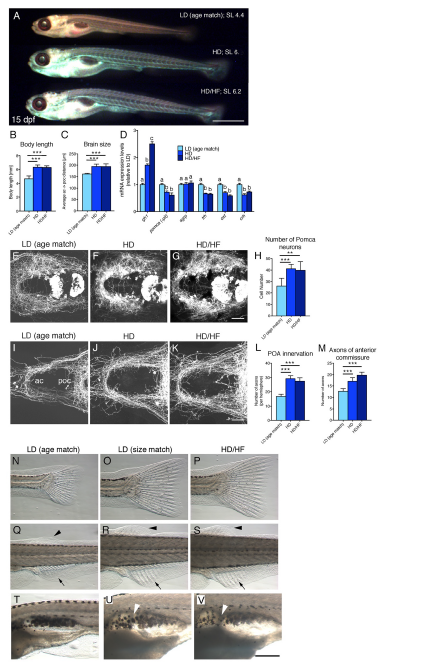
Strong impact of caloric input on somatic growth, neuronal circuit formation and developmental pace of zebrafish larvae – comparisons between age-matched larvae. Related to Figures 1 and 2.
Effects of caloric input on zebrafish larvae raised under LD, HD, or HD/HF feeding conditions from 5 -15 dpf. Analyses were performed at 15 dpf for all groups (age matched). (A) Lateral overview of larvae at 15 dpf stained with Nile red revealing strong differences in body length between LD (age match; standard body length (SL) = 4.4 mm) and HD (standard body length = 6.0 mm), HD/HF larvae (standard body length = 6.2 mm), respectively. Also note differences in fluorescent color profiles of Nile red likely reflecting differences in body fat composition. (B) Quantifications of body length (n=50) and (C) distance between anterior and postoptic commissures as a measure for brain size in pomca:EGFPras transgenic fish (n=5). (D) qRT-PCR analyses: mRNA levels for gh1, pomca (only neuronal fraction), agrp, trh, oxt and crh. Columns with different superscript letters (a,b,c) are significantly different from each other (p<0.05) according to ANOVA followed by a post hoc Tukey test. (E-M) Reduced number of Pomca hypothalamic neurons (E-H) and reduced innervation of preoptic area (POA) and anterior commissure (ac) in LD (age match) larvae compared to HD and HD/HF larvae assessed by anti-GFP IF on pomca:EGFPras transgenics (E-G; I-K) and subsequent quantifications of cell (H; n = 10) and axon numbers (L-M; n = 10). (N-V) Evaluation of developmental progress using anatomical criteria according to Parichy et al. (2009) revealing slower postembryonic development of LD (age match) larvae compared to HD and HD/HF larvae. (N-S) Development of caudal (N-P), dorsal (arrowhead in Q-S) and anal fins (arrow in Q-S) showing differences between LD (age match) versus HD and HD/HF larvae. (T-V) Budding of the anterior lobe of the swimbladder (arrowheads in T-V) has already taken place in HD and HD/HF but not in LD (age match) larvae. Scale bars: (A) 1 mm; (G) 50 μm for (E-G); (K) 50 μm for (I-K); (V) 250 μm for (N-V). p-values: (B, C, H, L, M) ** p < 0.05; *** p < 0.01 relative to LD (age match). Error bars in (B, C, D, H, L, M) show SD. (A, N-V) lateral views; (E-G; I-K) ventral views.