
|
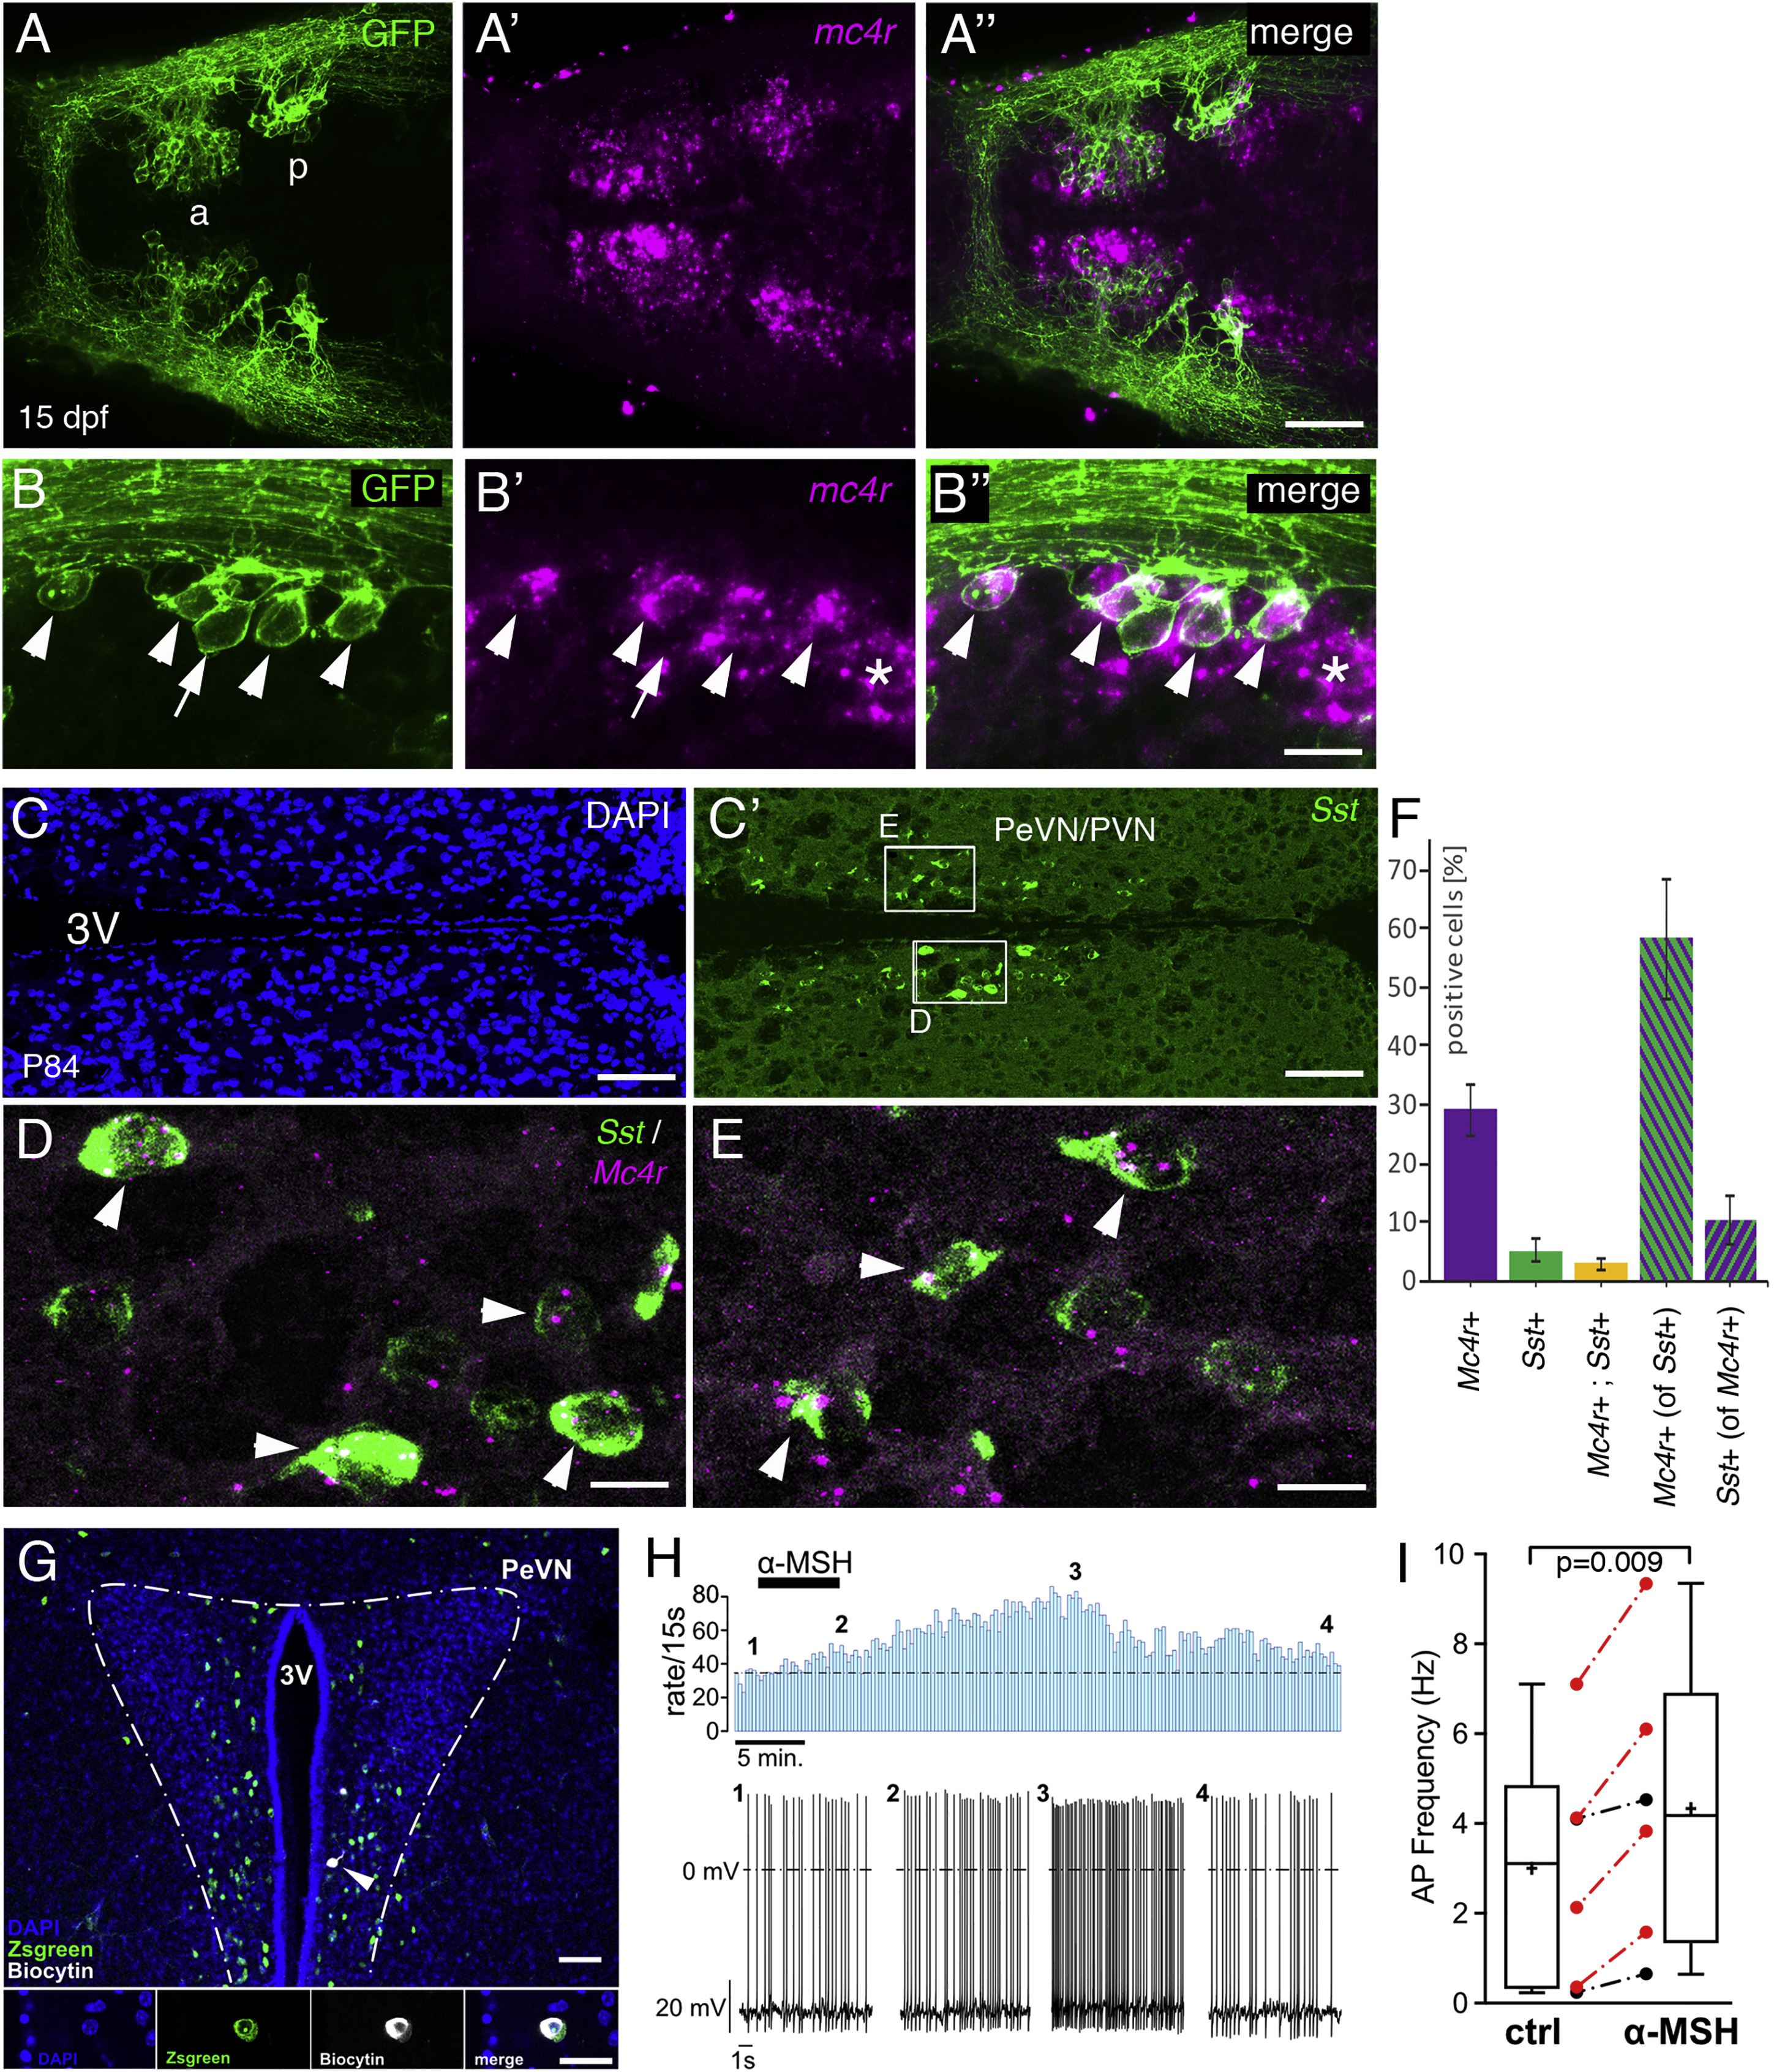
Fig. 6
Hypophysiotropic Sst Neurons in Zebrafish and Mouse Express mc4r Transcript and Respond to αMSH in Mouse
(A–B′′) sst1.1:EGFPras transgenic zebrafish at 15 dpf, stained via anti-GFP IF (green; [A] and [B]) in combination with mc4r ISH (magenta; [A′] and [B′]). Merged images are shown in (A′′) and (B′′).
(A–A′′) Overview of the POA showing mc4r+ cells in Sst1.1+ neurons of anterior (a) and posterior (p) POA clusters.
(B–B′′) Magnification of the posterior POA domain revealing expression of mc4r by most GFP+ cells (arrowheads, mc4r+,sst1+; arrow, mc4r−,sst1+; asterisk, mc4r+,sst1−).
(C–E) ISH for Sst (green; [C′]–[E]) and Mc4r (red; [D] and [E]) on sections of P84 mouse brains, counterstained with DAPI (nuclei, blue; [C]).
(C and C′) Overview of the PeVN/PVN hypothalamic region containing hypopyhsiotropic Sst cells.
(D and E) Magnification of boxed areas in (C′). Mc4r+ Sst neurons are marked by arrowheads.
(F) Quantification of Mc4r+ and Sst+ cells relative to total cell number (DAPI+), and quantification of Mc4r+ cells relative to Sst+ cells and vice versa (in percentage). Error bars show SD.
Scale bars represent 50 μm (A′′), 25 μm (B′′), 100 μm (C and C′), and 15 μm (D and E).
(G–I) αMSH increases the activity of Sst neurons in the PeVN of SstZsGreen mice.
(G) Top: overview of the PeVN (300 μm brain slice) showing ZsGreen immunofluorescence (green) and the Sst neuron that was labeled with biocytin (white, arrow) during the recording (blue, DAPI). Bottom: higher-magnified view of a single optical section of recorded neuron’s soma showing the DAPI−, Sst−, and biocytin label separately and merged (from left to right). Scale bars: overview, 50 μm; details, 20 μm. αMSH modulation of single Sst PeVN neuron (H). Firing rates (bin width 15 s) before, during, and after application of 250 nM αMSH (indicated by bar) (top). Original traces from the recording at indicated time points 1–4 (bottom). Boxplots showing the effect of αMSH (250 nM, 5–7 min) on the action potential frequency of Sst neurons measured 10 min after onset of αMSH application (p = 0.009, n = 6, from 5 mice; paired two-tailed t test) (I). Red symbols indicate neurons in which the increase in action potential frequency was larger than 3 × SD of the control, thus defining them as responsive. Whiskers indicate the minimum and maximum, and plus signs and horizontal lines indicate means and medians, respectively; error bars indicate SD.