
Image
|
Figure Caption
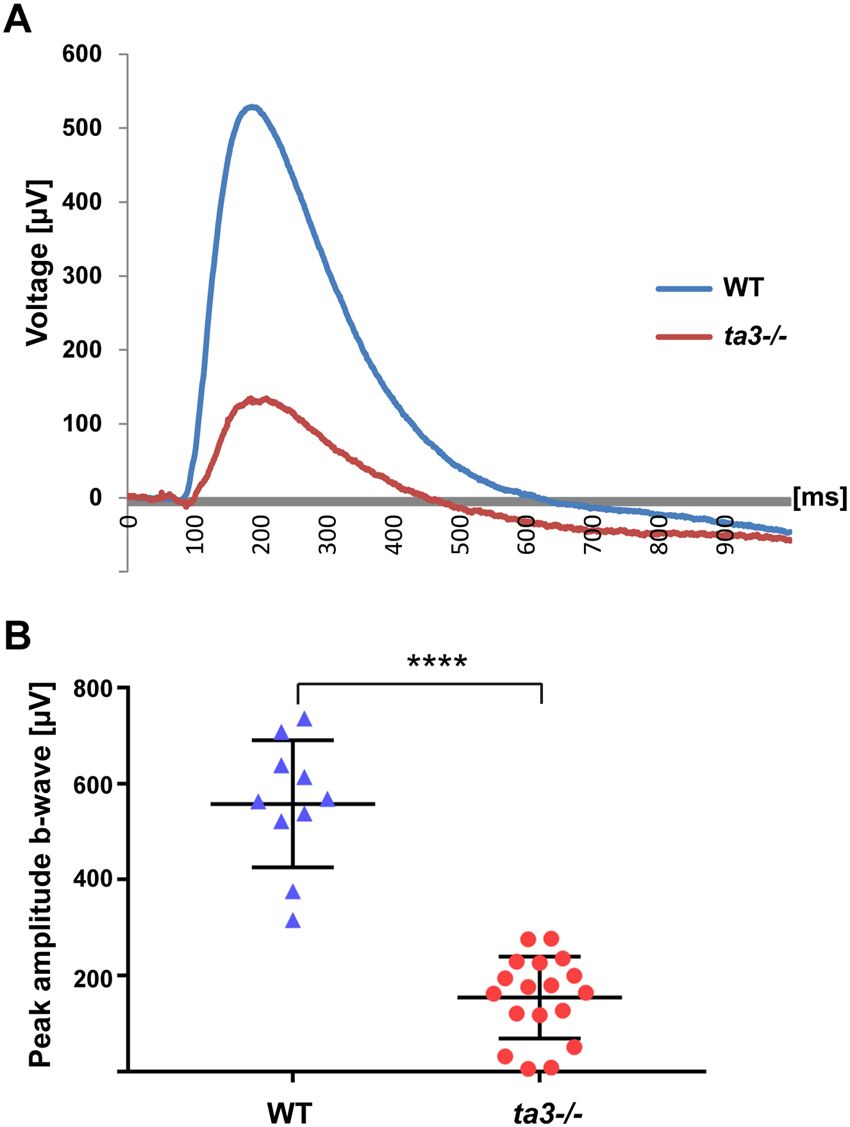
Fig. 3 Loss of Ta3 leads to visual function loss. (A) Representative electroretinogram (ERG) recording of wildtype (WT, blue curve) and ta3 mutant (red curve) 6 dpf larvae exposed to light stimuli of 7000 lux (bright light intensity). (B) Average b-wave peak responses for WT (blue triangles) and ta3 mutants (red circles) (n = 18 ta3 mutant animals and 10 WT animals). Bars represent standard deviation. ****p < 0.0001, Student’s t-test, n = 10 wildtype and 18 mutant larvae.
Figure Data
Acknowledgments
This image is the copyrighted work of the attributed author or publisher, and
ZFIN has permission only to display this image to its users.
Additional permissions should be obtained from the applicable author or publisher of the image.
Full text @ Sci. Rep.