
|
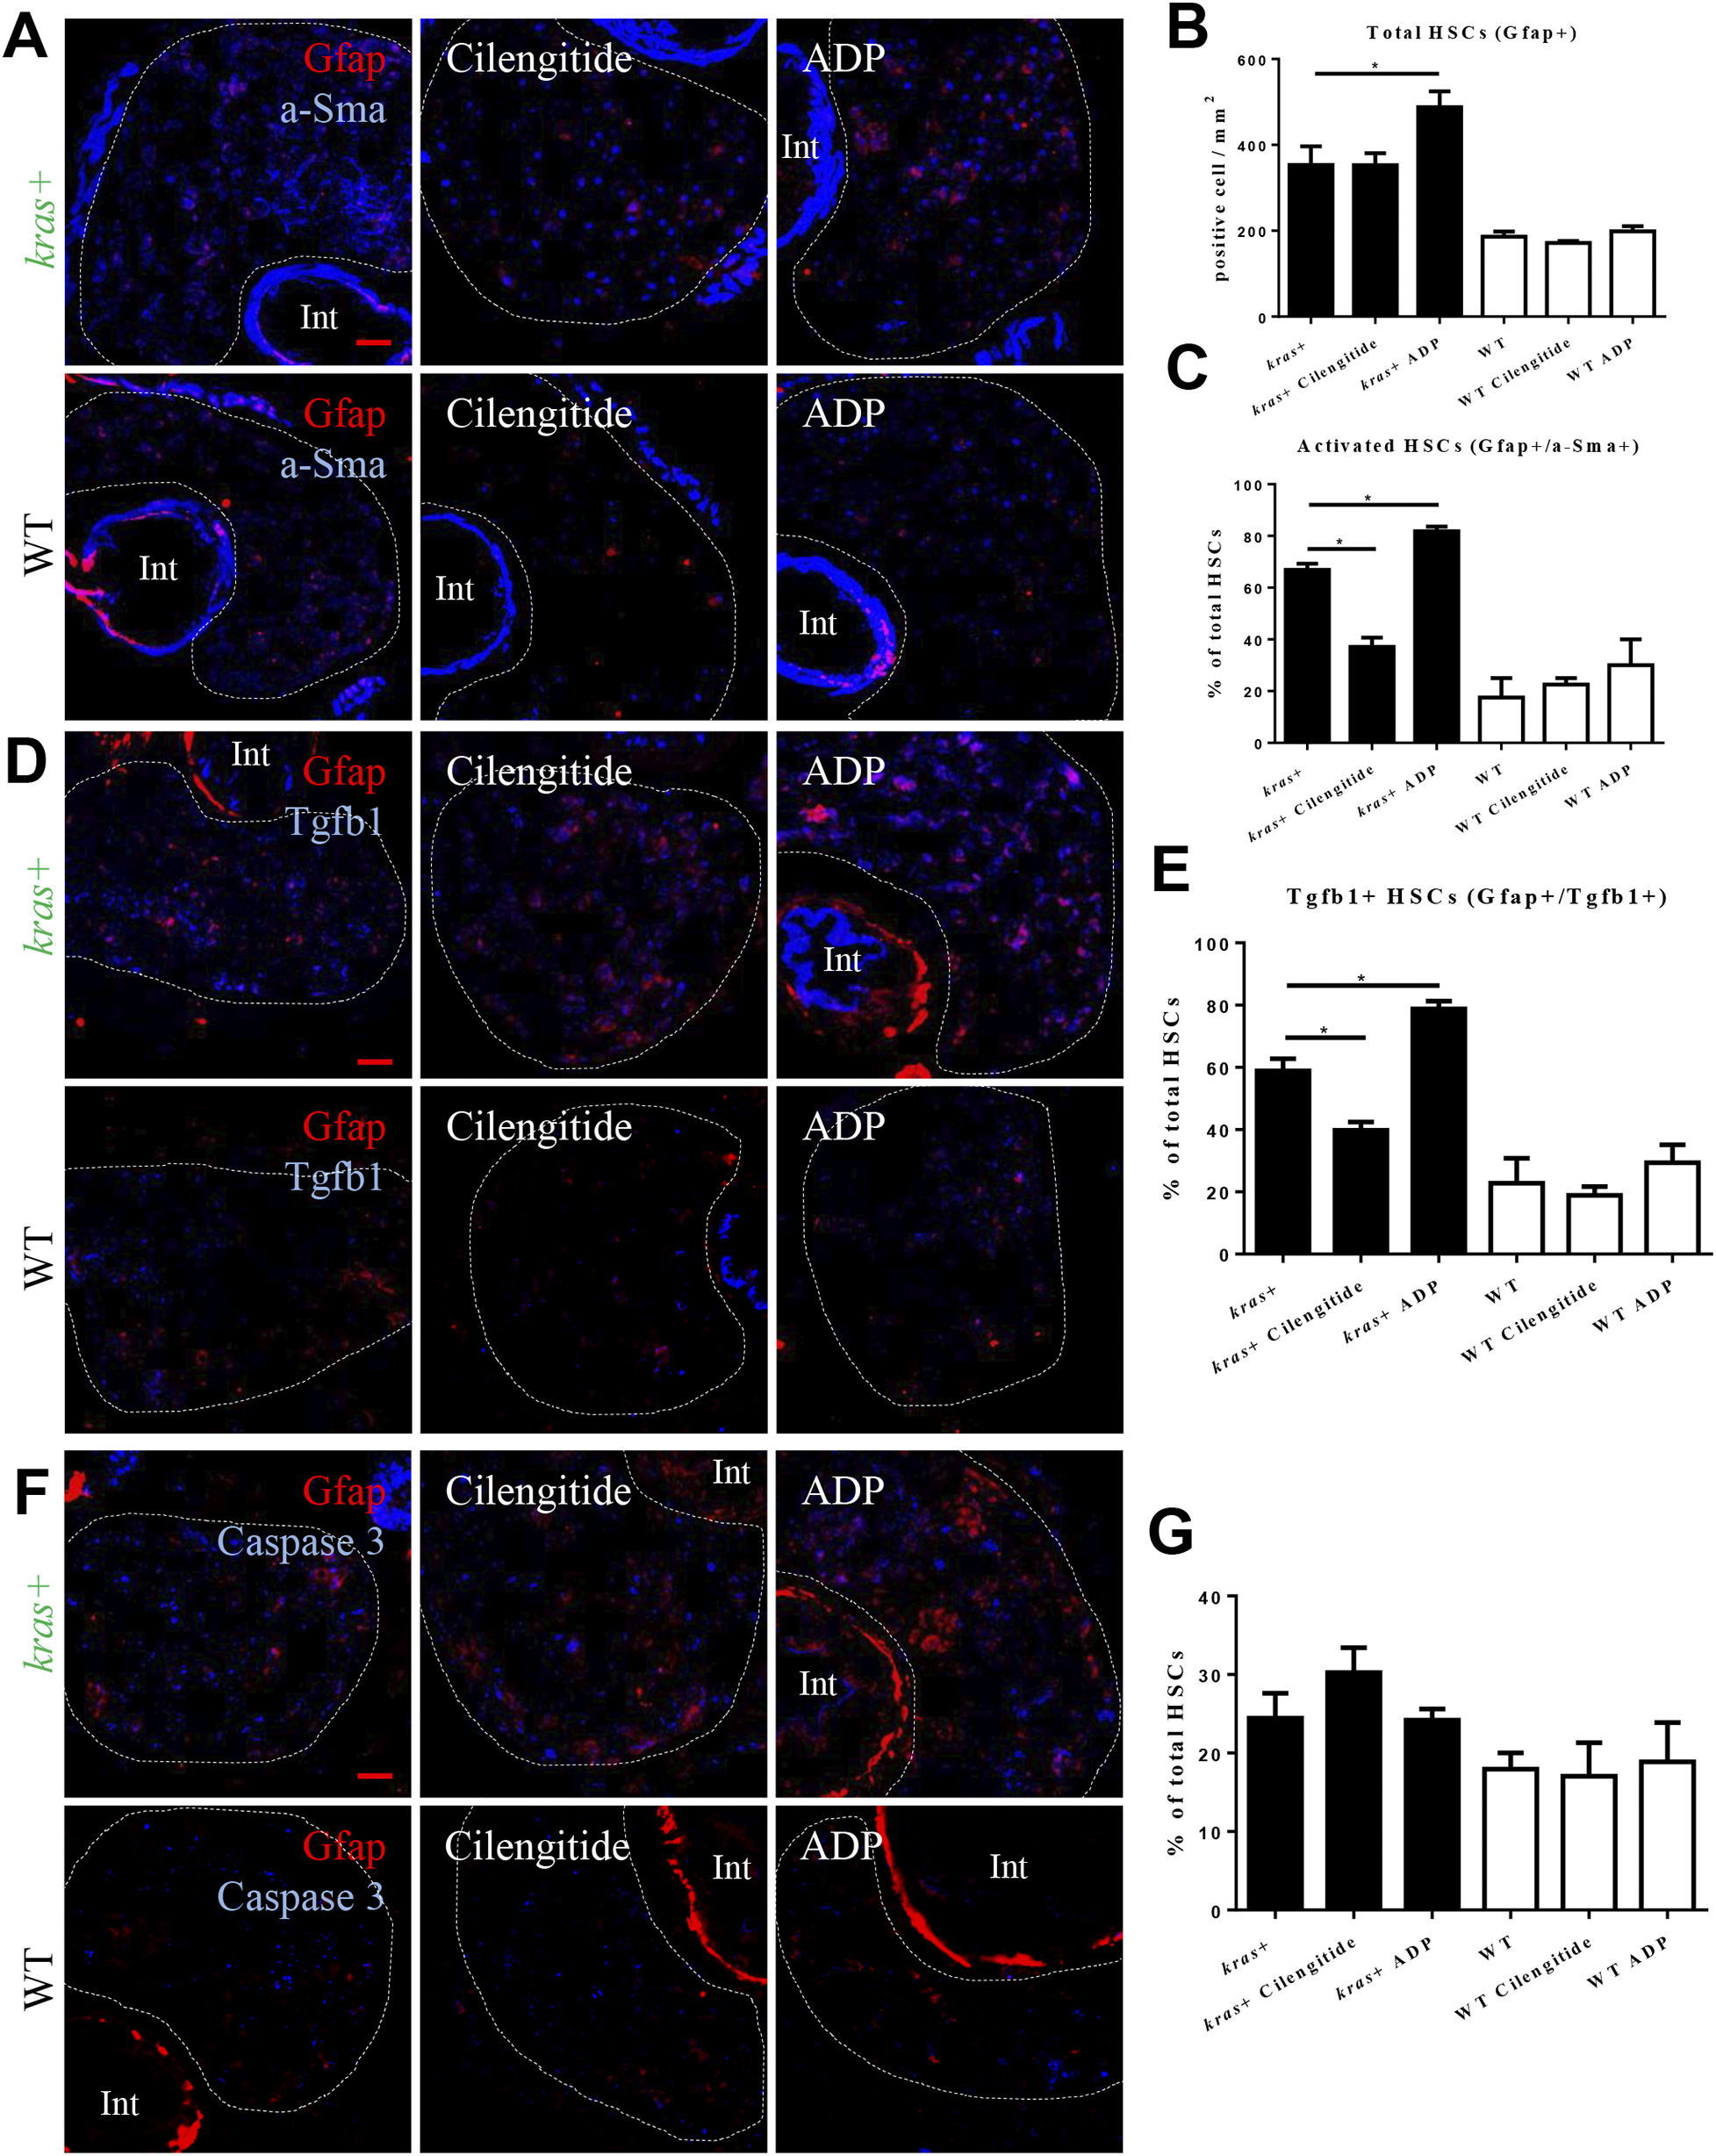
Fig. 3
Effects of manipulation of integrin αvβ5 activity on HSC. 3-dpi kras+ and WT larvae were treated cilengitide or ADP together with dox for 4 days. Liver sections were stained for various molecular markers and more than 20 fish were analyzed in each group. (A) IF co-staining of Gfap (red) and a-SMA (blue). (B) Quantification of total HSC density. (C) Quantification of ratio of activated HSCs. (D) IF co-staining of Gfap (red) and Tgfb1 (blue). (E) Quantification of percentage of Tgfb1-expressing HSCs. (F) IF co-staining of Gfap (red) and Caspase 3 (blue). (G) Quantification of percentage of apoptotic HSCs. Livers are marked by dash lines. Int indicates intestine. *P < .05. Scale bar: 20 μm.