
|
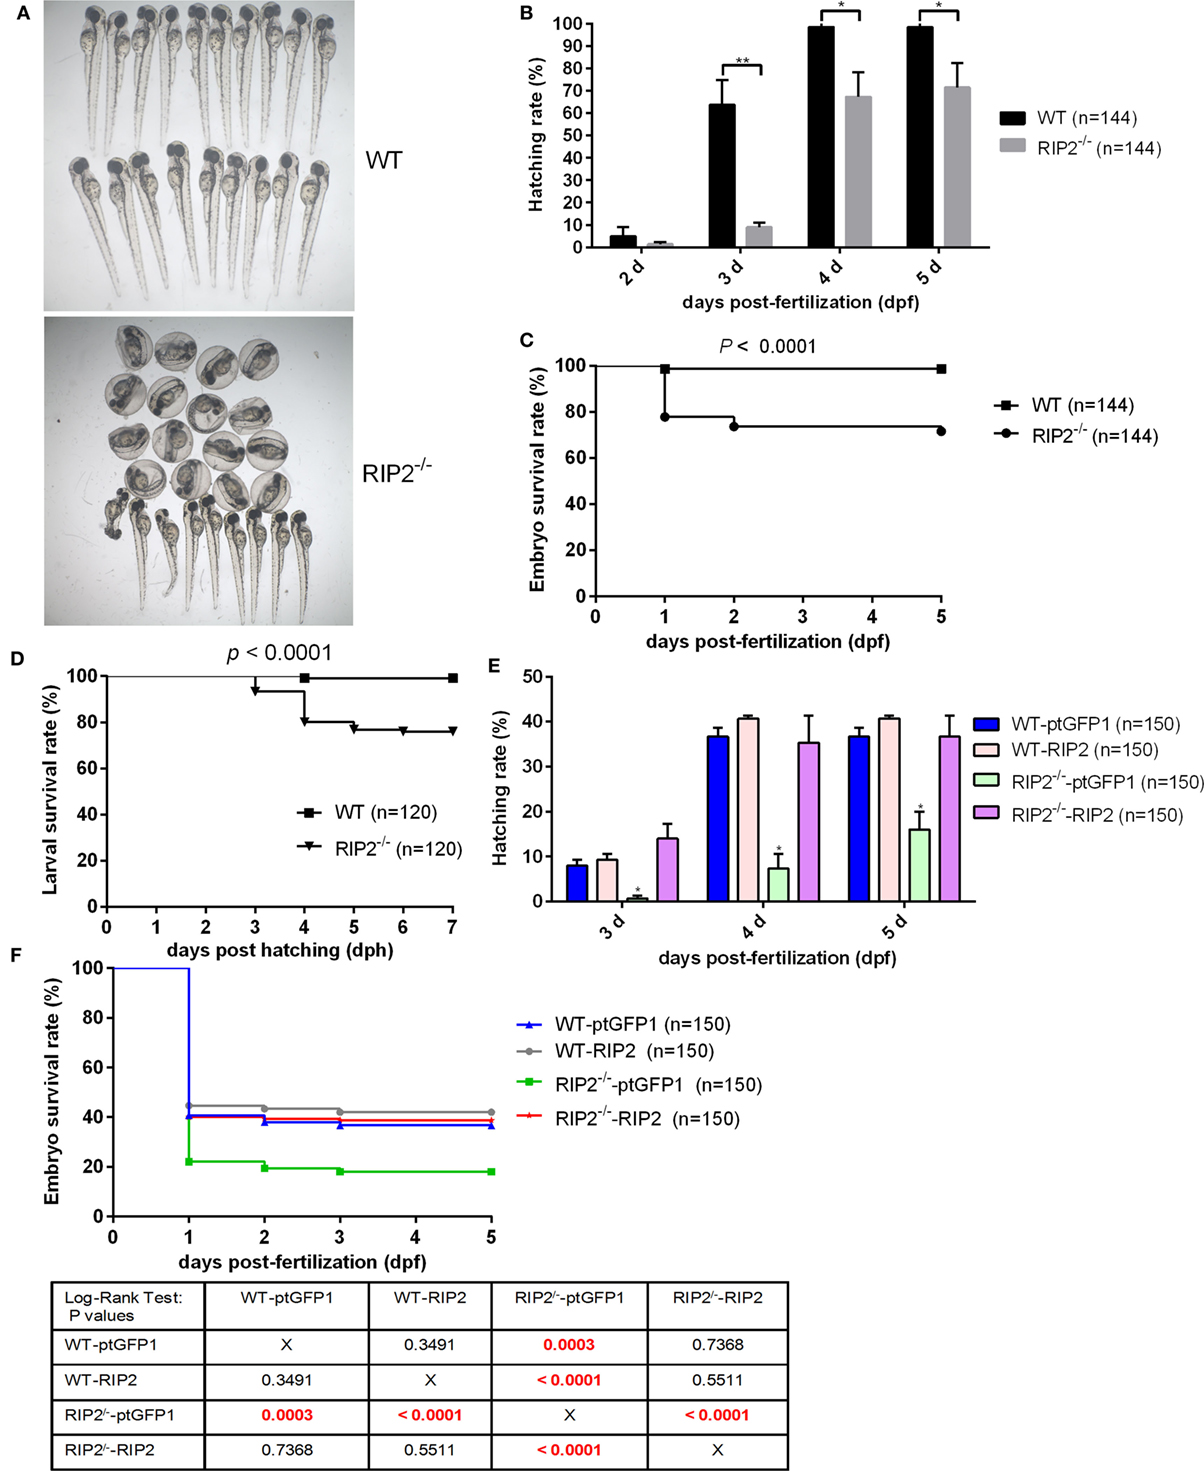
Fig. 1
RIP2 is critical for embryo hatching and larvae survival. (A) The images of embryos and larvae from WT and RIP2−/− zebrafish at 3 days post-fertilization (dpf). (B) The hatching rate of WT and RIP2−/− zebrafish at 2, 3, 4, and 5 dpf (n = 3, each with 48 embryos). Data represent the mean ± the SEM and were tested for statistical significance using two-tailed Student’s t-test. **p < 0.01, *p < 0.05. (C) The embryo survival curves of WT and RIP2−/− zebrafish (n = 3, each with 48 embryos). (D) The larval survival curves of WT and RIP2−/− zebrafish (n = 3, each with 40 larvae). The survival curves were compared statistically significant difference using the Log-Rank Test. (E) The hatching rate of WT and RIP2−/− zebrafish microinjected with ptGFP1 or ptGFP1-RIP2 at 3, 4, and 5 dpf (n = 2, each with 75 embryos). Data represent the mean ± the SEM, and were tested for statistical significance using two-tailed Student’s t-test. *p < 0.05. (F) The embryo survival curves of WT and RIP2−/− zebrafish microinjected with ptGFP1 or ptGFP1-RIP2 (n = 2, each with 75 embryos). The survival curves were compared statistically significant difference using the Log-Rank Test. The P-values lower than 0.001 were in red.