
Image
|
Figure Caption
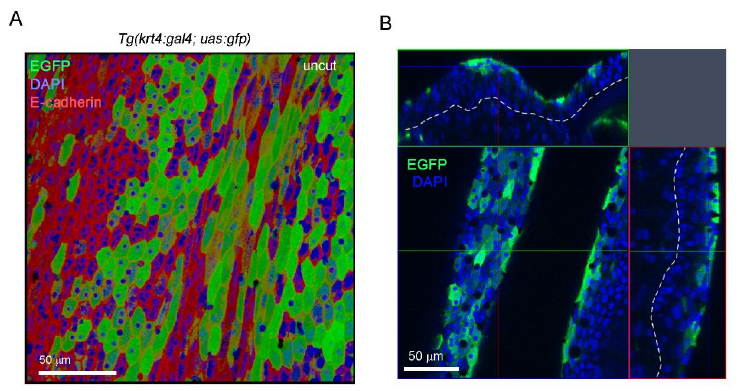
Fig. S5
Expression of EGFP in an uncut fin from a Tg(krt4:gal4; uas:gfp).
(A) Immunohistochemical detection of E-cadherin (red) and EGFP (green) in an uncut fin from a Tg(krt4:gal4; uas:gfp). The nuclei were counterstained with DAPI (blue). Scale bar, 50 m. (B) Confocal image of the Tg(krt4:gal4; uas:gfp) fin shown in (A). Top and right images are the tomographic images reconstituted from the z-stack data. The white dotted lines indicates the boundary between the epidermis and the mesenchyme. EGFP+ cells are mostly localised in the suprabasal and surface epidermal layers. Scale bar, 50 m.
Acknowledgments
This image is the copyrighted work of the attributed author or publisher, and
ZFIN has permission only to display this image to its users.
Additional permissions should be obtained from the applicable author or publisher of the image.
Full text @ Development