
|
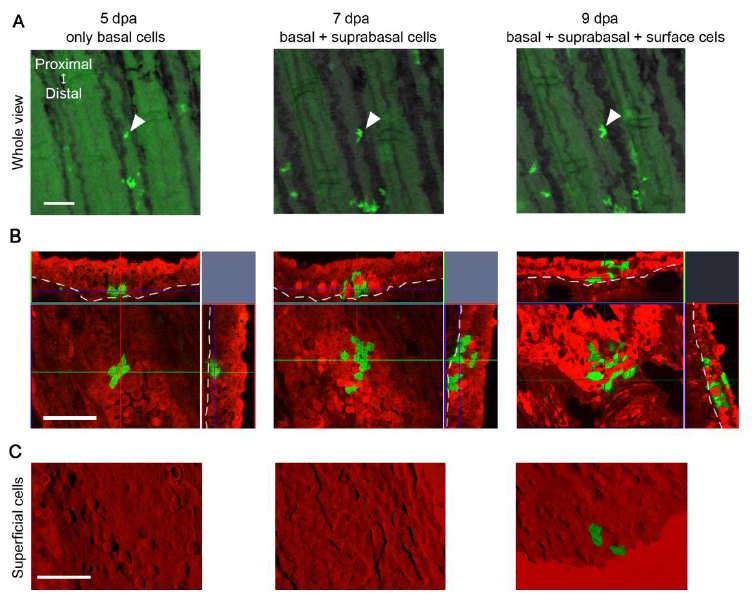
Fig. S4
Fate tracking of a single clone.
(A) Whole mount images of a representative clone (white arrowheads) at 5, 7, and 9 dpa. Scale bar, 100 m. (B) Confocal images of the same clone (No. 11) at respective stages. The top and right images are tomographic images reconstituted from the z-stack data. The dotted lines show the boundary between epidermal cells and mesenchymal cells. The clone contained only basal cells at 5 dpa, but produced suprabasal and surface cells at later stages. Scale bar, 50 m. (C) Confocal optical sections of the same clone (No. 11) focusing on the surface cells within the same region of the epidermis. Respective pictures show the same area and in the same direction with those in (B). Scale bar, 50 m.