
IMAGE
Fig. S2
- ID
- ZDB-IMAGE-180712-42
- Publication
- Shibata et al., 2018 - Heterogeneous fates and dynamic rearrangement of regenerative epidermis-derived cells during zebrafish fin regeneration
- All Figures
- Figures for Shibata et al., 2018
Image
|
Figure Caption
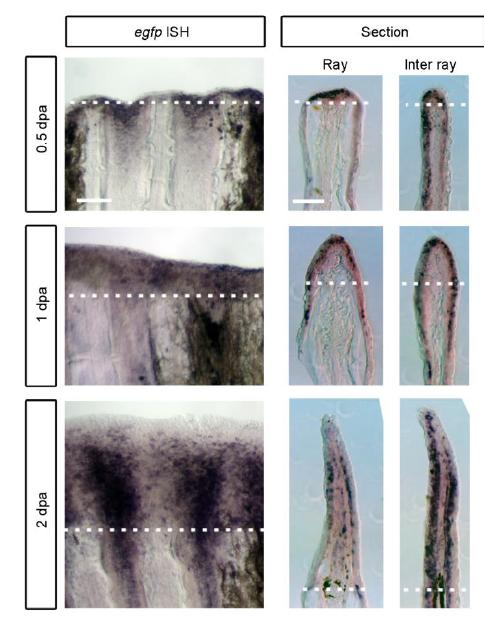
Fig. S2
egfp mRNA expression in the Tg(fn1b:egfp).
Whole mount ISH analysis of the egfp expression in the Tg(fn1b:egfp) at 0.5, 1 and 2 dpa. Respective sections through the ray and inter-ray regions are shown on the respective right side. The dotted lines indicate the amputation plane. The expression is nearly the same with that of endogenous fn1b shown in Fig. 1A. Scale bars, 100 m (whole-mounts) and 50 m (sections).
Acknowledgments
This image is the copyrighted work of the attributed author or publisher, and
ZFIN has permission only to display this image to its users.
Additional permissions should be obtained from the applicable author or publisher of the image.
Full text @ Development