
|
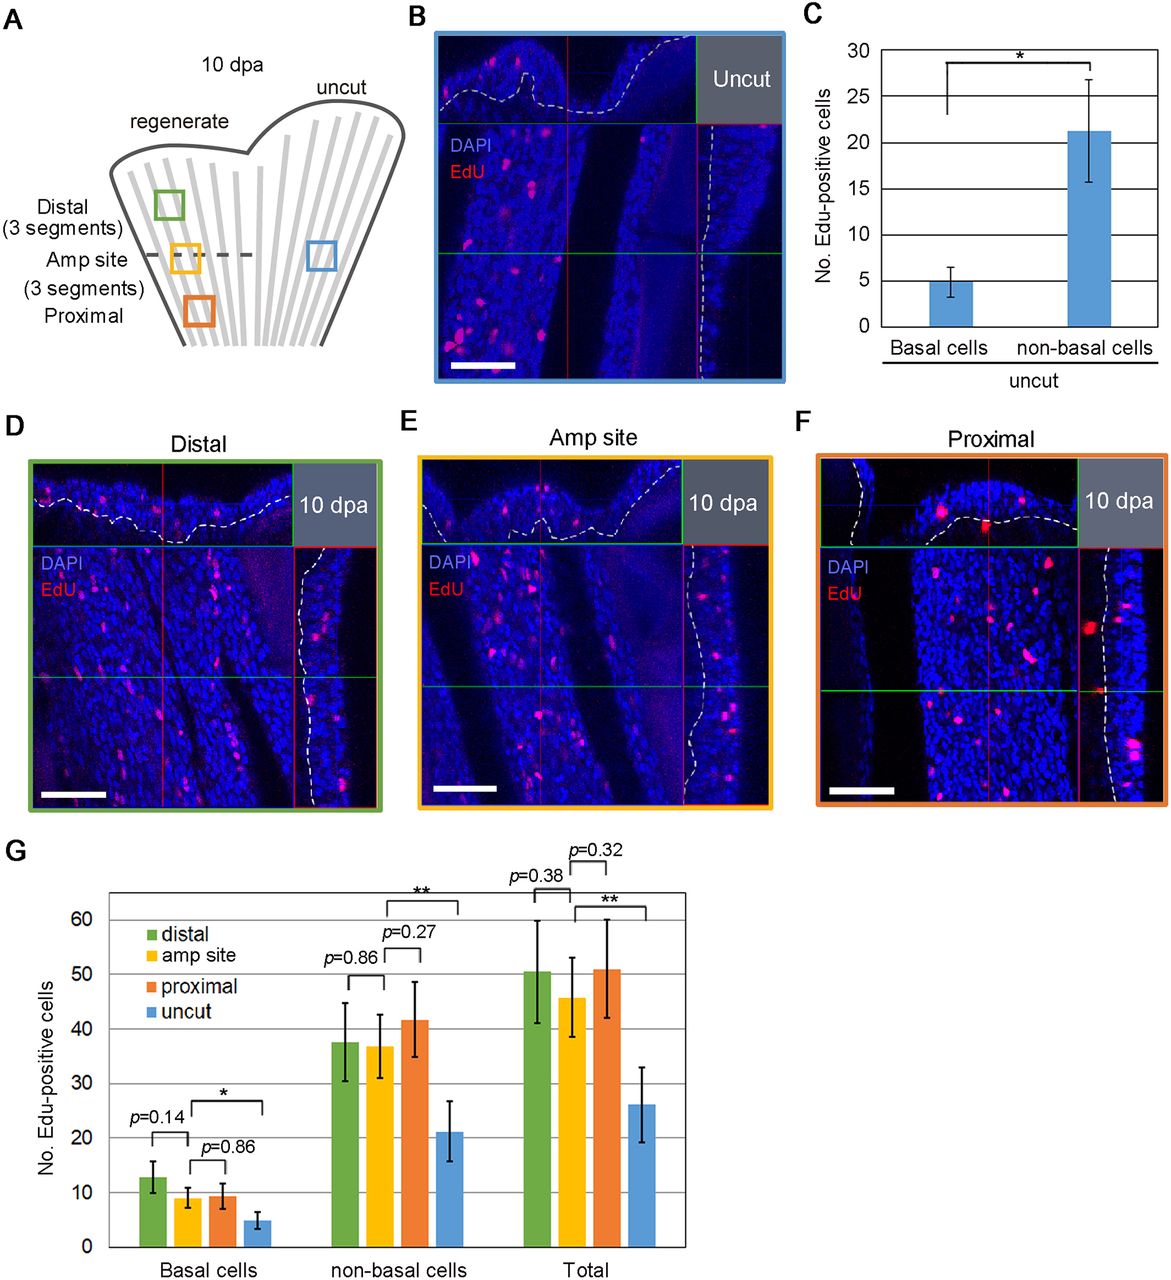
Fig. 7
Global cell proliferation replenishes epidermal cells. (A) Schematic diagram showing the process used for quantification of EdU+ epidermal cells. The dorsal half of the fin was amputated at the middle of the central fin ray. The numbers of EdU+ cells were scored in four fin areas of a 10 dpa fin (212×212 µm); the central region at the level of the amputation site (Amp site, yellow box), the distal region (three segments distal to the amputation site; Distal, green box), the proximal region (three segments proximal to the amputation site; Proximal, orange box), and the uncut region at the level of amputated site (blue box). As the number of EdU+ cells were nearly the same in the proximal and distal parts of the uncut fin region, scoring was carried out in the central region at the site of amputation. (B) Detection of EdU+ cells in the epidermis using confocal optical sections in the uncut region (blue box in A). Confocal longitudinal and transverse optical sections are shown at the top and on the right, respectively. The vertical and horizontal red and green lines indicate the approximate sites of the optical sections. Nuclei were counterstained with DAPI. The white dotted lines show the boundary of the epidermis and mesenchyme. Scale bar: 50 µm. (C) Quantification of the number of EdU+ cells in B. The number of cells were counted on confocal images (n=10 images from 5 zebrafish). Data are mean±s.e.m.; Student's t-test (two-tailed) was performed to assess statistical significance. *P<0.05. (D-F) Detection of EdU+ cells in the epidermis using confocal optical sections in the distal region (D, green box in A), the central region (E, yellow box in A) and the proximal region (F, orange box in A). Nuclei were counterstained with DAPI. White dotted lines indicate the boundaries between epidermis and mesenchyme. Scale bars: 50 µm. (G) Quantification of the number of EdU+ cells in D-F and comparison with those in uncut fin in C. The respective colours of the bars represent the regions shown in A. The number of cells was counted on confocal images (n=10 images from different areas of five zebrafish). Data are mean±s.e.m.; Student's t-test (two-tailed) was performed to assess statistical significance. *P<0.05; **P<0.005.