
|
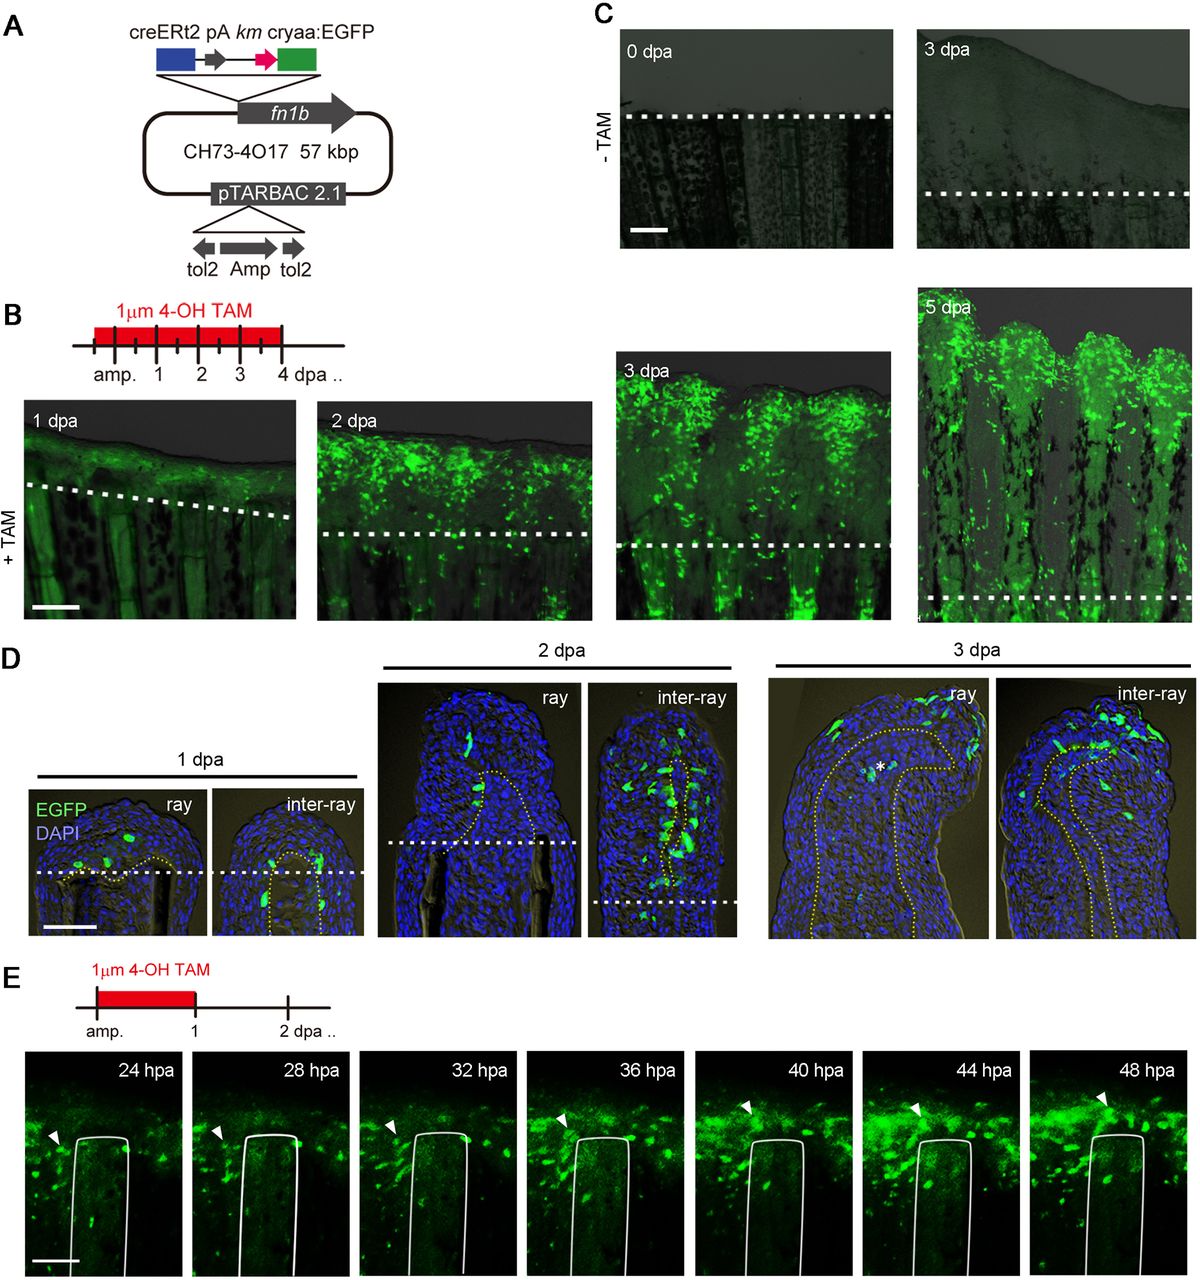
Fig. 2
Tracking cell fates of the RE using Tg(fn1b:creERt2). (A) Map of the BAC construct used to generate Tg(fn1b:creERt2). The creERt2 cassette was inserted in place of the egfp cassette at the site of the fn1b gene in the CH73-4O17 BAC. cryaa, crystalline alpha a promoter. (B) Labelling of fn1b-expressing cells by Cre-loxP recombination in the double Tg(fn1b:creERt2;Olactb:loxP-dsred2-loxP-egfp). The Tg was treated with 1 µM 4-OH TAM from 12 h before amputation until 4 dpa. The dotted lines indicate the amputation planes. Scale bar: 200 µm. (C) Absence of EGFP+ cells in the double Tg fin in the absence of 4-OH TAM treatment. Scale bar: 200 µm. (D) Longitudinal tissue sections of Cre-labelled fins at 1, 2 and 3 dpa, labelled as in B. The dotted lines indicate the amputation planes. Scale bar: 50 µm. For B-D, n>5 fins (B,C) or sections (D). The sections were counterstained with DAPI (blue). (E) Time-lapse analysis of Cre-labelled EGFP+ cells from 24 hpa until 48 hpa. Images were captured every 1 h (n=3 fins). Only the images at 24, 28, 32, 36, 40, 44 and 48 hpa are shown. The arrowheads indicate a representative tracking of the same cell over time, indicating that the labelled cell indeed migrated from the inter-ray region to the ray region. The white lines show the outline of the fin ray bone. Scale bar: 100 µm.