
|
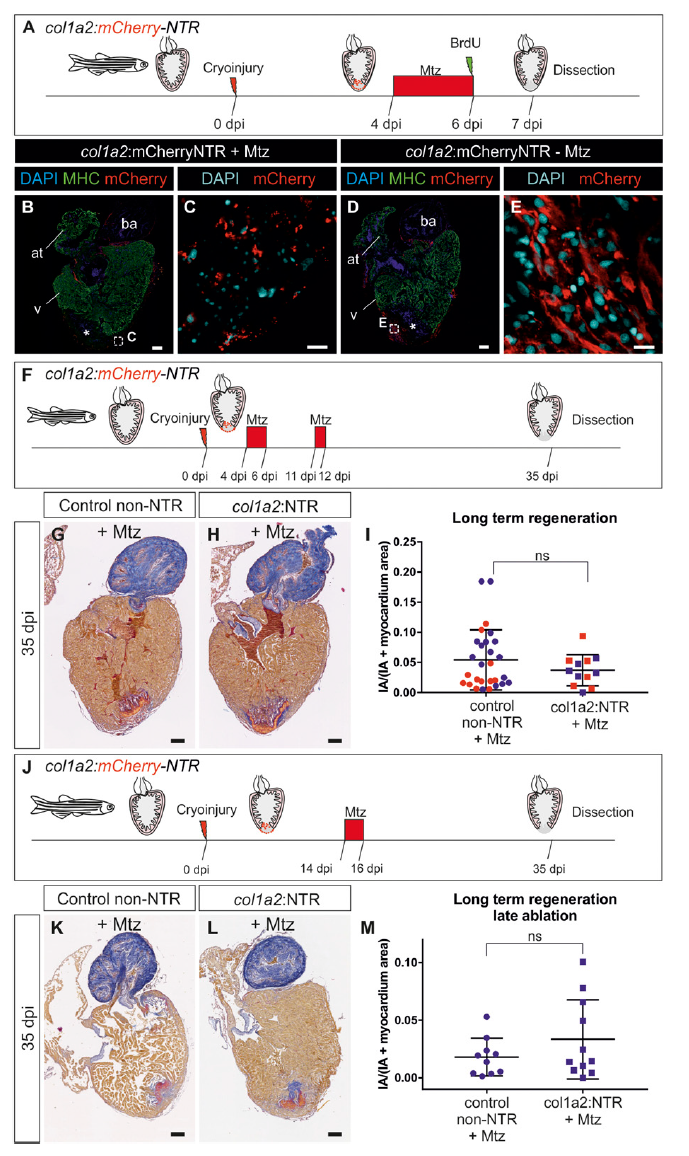
Fig. S9
Heart regeneration upon genetic ablation of col1a2-expressing cells. (A) col1a2:mCherry-NTR (in short col1a2:NTR) adult animals were cryoinjured and treated with Mtz from 4 to 6 dpi. BrdU injection was performed 1 d before fixation to assess cardiomyocyte proliferation. (B–E) Immunofluorescence of heart sections of col1a2:mCherry-NTR treated with Mtz (B and C) or untreated controls (D and E). mCherry, red; MHC, green; nuclei (DAPI), blue for B and D, and cyan for C and E. Asterisk, injured area. In Mtz-treated fish, col1a2:mCherry-NTR labels cells with fragmented nuclei and the homogeneous mCherry expression observed in the wild-type heart is lost. (F) Experimental scheme to study regeneration upon genetic ablation of col1a2-expressing cells. col1a2:NTR transgenic zebrafish were cryoinjured and treated with 10 mM Mtz between 4 to 6 and 11 to 12 dpi. Hearts were dissected at 35 dpi, sectioned, and stained with AFOG to determine the degree of regeneration. (G and H) AFOG-stained sagittal sections through ventricles of a Mtz-treated col1a2:loxP-tagBFP-loxPmCherry- NTR heart (control) and a Mtz-treated col1a2:NTR heart. (I) Quantification of the injury area versus total ventricular area from 28 control hearts and 12 col1a2:NTR hearts. Blue and red colors indicate results from two independent experiments. Shown are individual measurements as well as mean and SD. No significant difference was observed between control and col1a2:NTR groups by unpaired Student’s t test (P = 0.75). (J) Experimental scheme. col1a2:NTR transgenic zebrafish were cryoinjured and treated with 10 mM Mtz between 14 and 16 dpi. Hearts were dissected at 35 dpi, sectioned, and stained with AFOG to determine the degree of regeneration. (K and L) AFOG-stained sagittal sections through ventricles of a Mtz-treated col1a2:loxP-tagBFP-loxP-mCherry-NTR heart (control) and a Mtz-treated col1a2:NTR heart. (M) Quantification of the injury area versus total ventricular area from 10 control hearts and 11 col1a2:NTR hearts. Shown are individual measurements as well as mean and SD. No significant difference was observed between control and col1a2:NTR groups by unpaired Student’s t test (P = 0.2113). (Scale bars, 100 μm.)