
Image
|
Figure Caption
Fig. S6
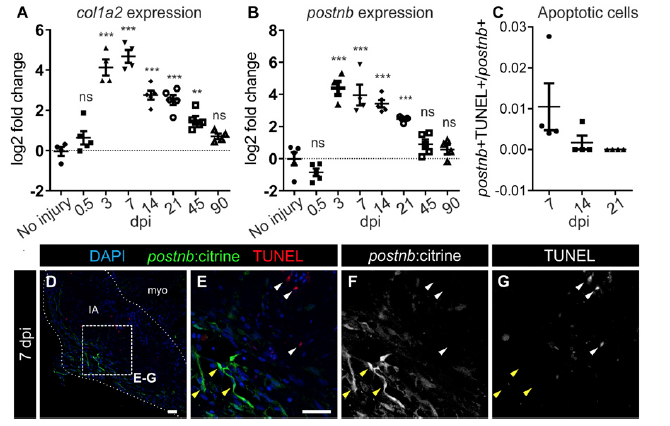
Apoptotic and senescent fibroblasts during heart regeneration. (A and B) qPCR of col1a2 and postnb at different days postinjury. Symbols show data for individual samples; bars and whiskers show mean ± SD; ***P < 0.001, **P < 0.01 by one-way ANOVA followed by Tukey’s multiple comparisons test. ns, not significant. (C) postnb+ apoptotic (TUNEL+) cell quantification. (D–G) TUNEL staining of postnb:citrine heart sections. myo, myocardium. pstnb:citrine+ cells, yellow arrowheads; TUNEL+ cells, white arrowheads. (Scale bars, 25 μm.)
Acknowledgments
This image is the copyrighted work of the attributed author or publisher, and
ZFIN has permission only to display this image to its users.
Additional permissions should be obtained from the applicable author or publisher of the image.
Full text @ Proc. Natl. Acad. Sci. USA