
|
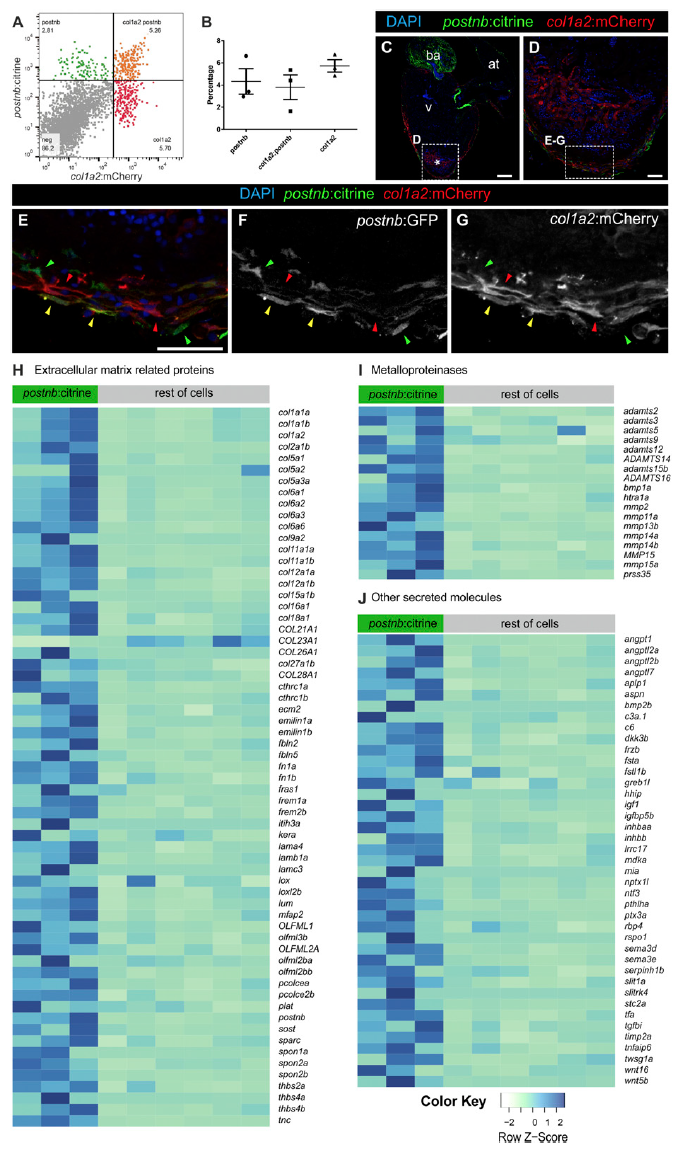
Fig. S5
Colocalization of postnb:citrine+ and col1a2:mCherry+ cells. (A and B) FACS-sorted cells of 7 dpi hearts from co1a2:mCherry;postnb:citrine doubletransgenic fish. Based on these markers, three populations could be detected: double-positive, postnb+, and col1a2+. Shown are individual measurements as well as mean and SD. (C–G) Immunofluorescence with anti-GFP (green) and anti-mCherry (red) of a heart section from an adult postnb:citrine;col1a2:mCherry- NTR fish. Note the presence of double-positive (yellow arrowheads), col1a2+ (red arrowheads), and postnb+ cells (green arrowheads). (H–J) Heatmaps representing the expression levels of all of the secreted proteins that were identified to be up-regulated when comparing postnb:citrine+ cells at 7 dpi with the rest of the cells at the injury (with the exception of the kdrl:mCherry population). Fragments per kilobase million values were used. The list of genes encoding secreted molecules was obtained by using Ingenuity software and manually adding the genes encoding for collagens and metalloproteinases not identified by Ingenuity. For better visualization of changes in gene expression between the two groups, values were scaled independently for each gene, that is, each row. [Scale bars, 25 μm (C) and 100 μm (D and E).]