
|
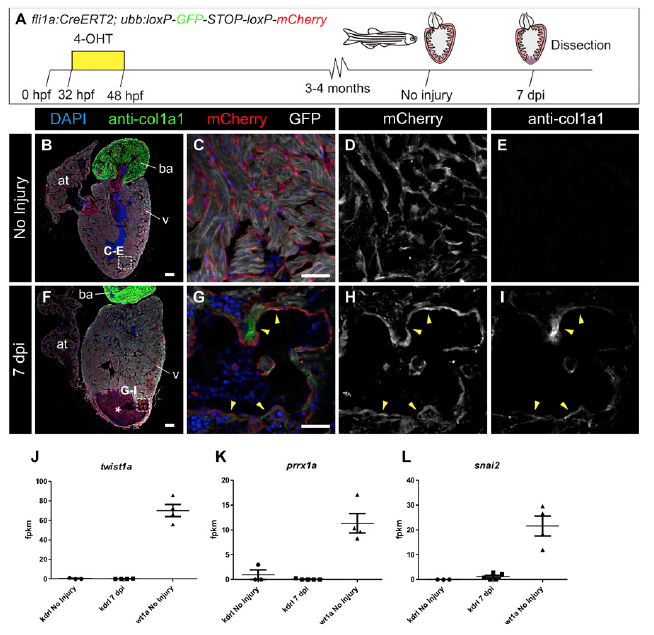
Fig. S4
Endocardial cells at the injury area express collagen 1a1 but not EMT markers. (A–I) Lineage tracing of endocardial cells in the uninjured and injured heart. (A) Experimental scheme for tracing the contribution of endocardial cells to fibrosis using the ubb:Switch reporter line. (B and F) Immunofluorescence staining of whole-heart sagittal sections (B, uninjured; F, 7 dpi) with anti-mCherry (red), anti-col1a1 (green), and anti-MHC (gray); nuclei were DAPIcounterstained (blue). C–E and G–I are merged and single channels of a zoomed-in view of the endocardial border in the apex or close to the injury area (IA; asterisk). fli1a-derived cells are mCherry+ (red). Note that at 7 dpi, mCherry+ cells (red) are closely associated with col1a1 (green) deposits (arrowheads). (J– L) Epithelial-to-mesenchymal transition (EMT) markers are expressed by wt1a:GFP+ cells but not by kdrl:mCherry+ cells. Graphs show the fragments per kilobase million (fpkm) values for the same genes and samples. Shown are individual measurements as well as mean and SD. EMT genes were more abundant in wt1a+ cells than in kdrl+ cells both before and after injury. [Scale bars, 25 μm (C and G) and 100 μm (B and F).]