
|
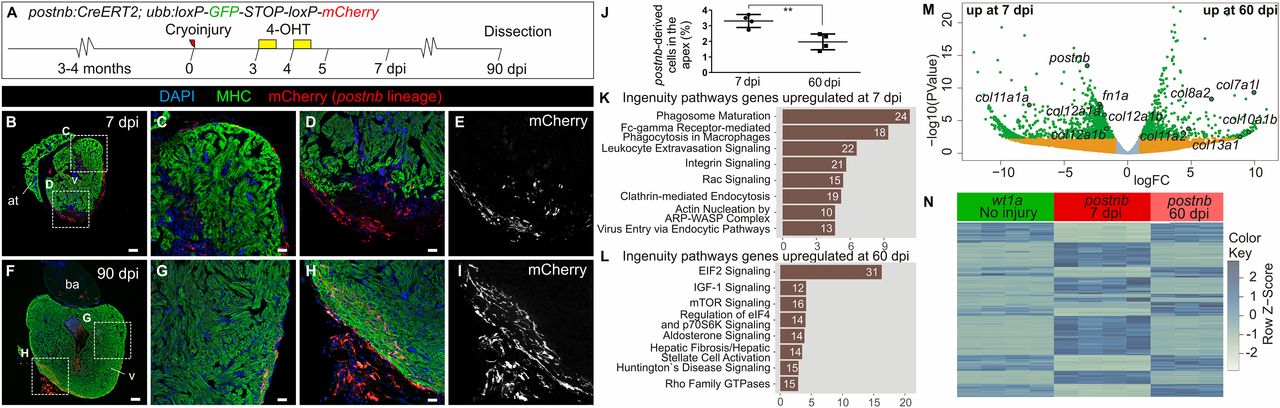
Fig. 4
Persistence of postnb-derived cells in the regenerated myocardium. (A) 4-Hydroxytamoxifen was added to postnb:CreERT2;ubb:Switch fish at 3 and 4 dpi, and hearts were dissected at different dpi. (B–I) Immunofluorescence staining of heart sections at 7 (B–E) or 90 dpi (F–I). (J) Percentage of postnb-derived cells at the injury area. Symbols show individual measurements, and boxes and whiskers show mean ± SD; **P = 0.0064 by two-tailed unpaired t test. (K–M) postnb-derived mCherry+ cells were sorted from the ventricular apex at 7 and 60 dpi, and transcriptome analysis was performed on isolated mCherry+ cells. (K and L) Ingenuity pathway analysis. Bars represent pathways enriched in postnb-derived cells compared with the remainder of cells in the injury area at 7 and 60 dpi. Numbers of differentially expressed genes are indicated. The x axis shows −log10(B.H. P values). (M) Volcano plot. Light blue, FDR >0.05, abs(LFC) <1; orange, FDR >0.05, abs(LFC) >1; green, FDR <0.05, abs(LFC) >1. (N) Heatmap of the top 200 differentially expressed genes between 7 and 60 dpi in postnb-traced cells and their expression in wt1a:GFP+ cells from uninjured hearts. [Scale bars, 25 µm (C–E and G–I) and 100 µm (B and F).]