
|
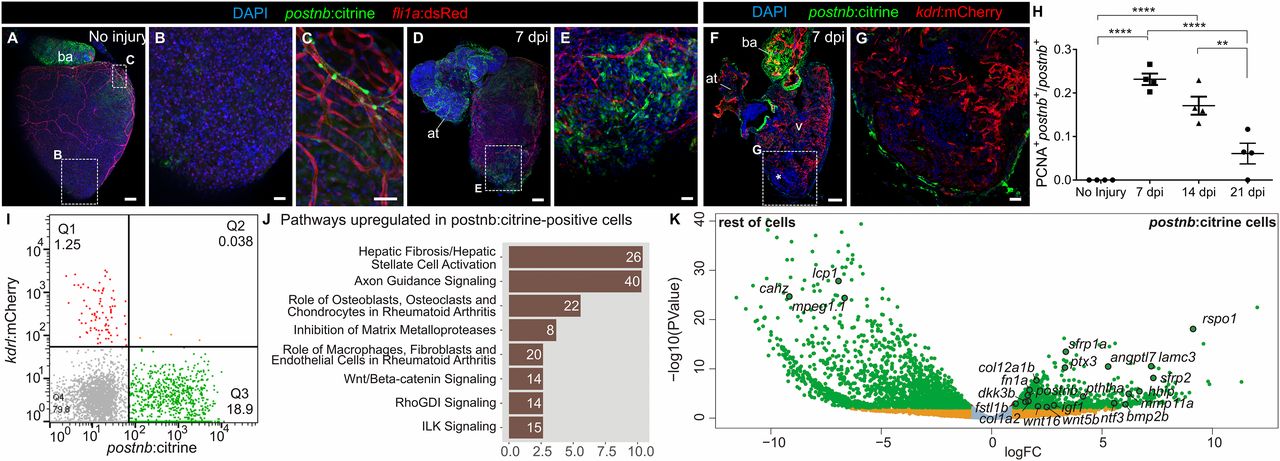
Fig. 3
periostin b expression marks an activated cardiac fibroblast population upon ventricular cryoinjury. (A–E) Whole-heart immunofluorescence in the postnb:citrine; fli1a:dsRedEx double-transgenic line. Whole-heart (A) and zoomed-in views (B and C) of the ventricular apex of an uninjured heart and a heart at 7 dpi (D and E). Perivascular cells can be observed in C. postnb:citrine, green; fli1a:dsRedEx, red. (F and G) Immunofluorescence staining of a sagittal heart section of a postnb:citrine;kdrl:mCherry zebrafish (F). Asterisk in F marks the injury area. (G) Zoomed-in view of the injured ventricular apex. postnb:citrine, green; kdrl:mCherry, red. (H) Quantification of proliferating postnb+ cells postinjury (mean ± SD; ****P < 0.0001, **P < 0.01 by one-way ANOVA followed by Tukey’s multiple comparisons test). (I) FACS-sorted cells from kdrl:mCherry;postnb:citrine hearts. No double-positive cells were detected. (J and K) Transcriptome analysis of postnb:citrine+ cells isolated from the ventricular apex. (J) Ingenuity pathway analysis. The x axis shows −log10(B.H. P values). (K) Volcano plot. Light blue, FDR >0.05, abs(LFC) <1; orange, FDR <0.05, abs(LFC) <1; green, FDR <0.05, abs(LFC) >1. [Scale bars, 25 µm (B, C, E, and G) and 100 µm (A, D, and F).]